


Gain a 360° Overview of
Your Shopify Store
Get a bird’s eye view of all the key aspects of your business:


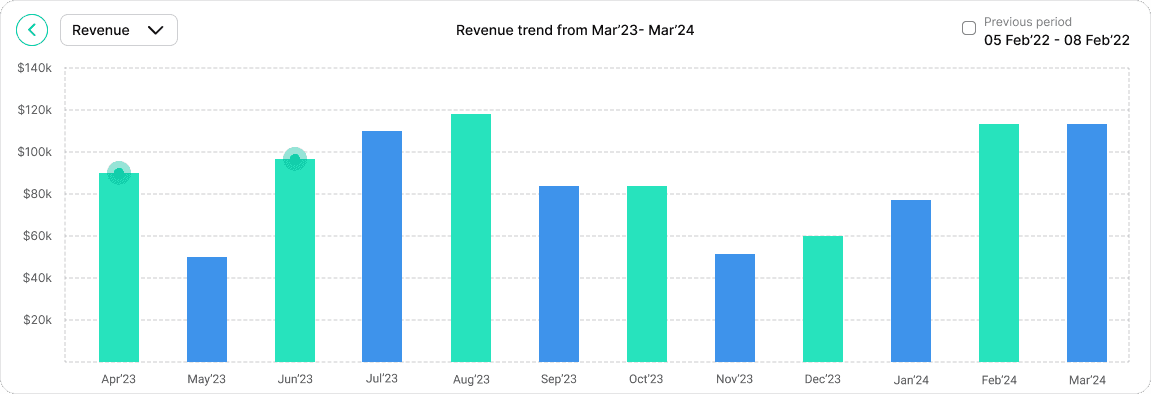
Real-Time Shopify
P&L Dashboard - At a Glance
See the metrics that matter net profit, contribution margin, ad returns without digging through reports. Stay informed, stay profitable.


Add Metrics
Profit Metrics
Marketing metrics
Customer Metrics
Product metrics
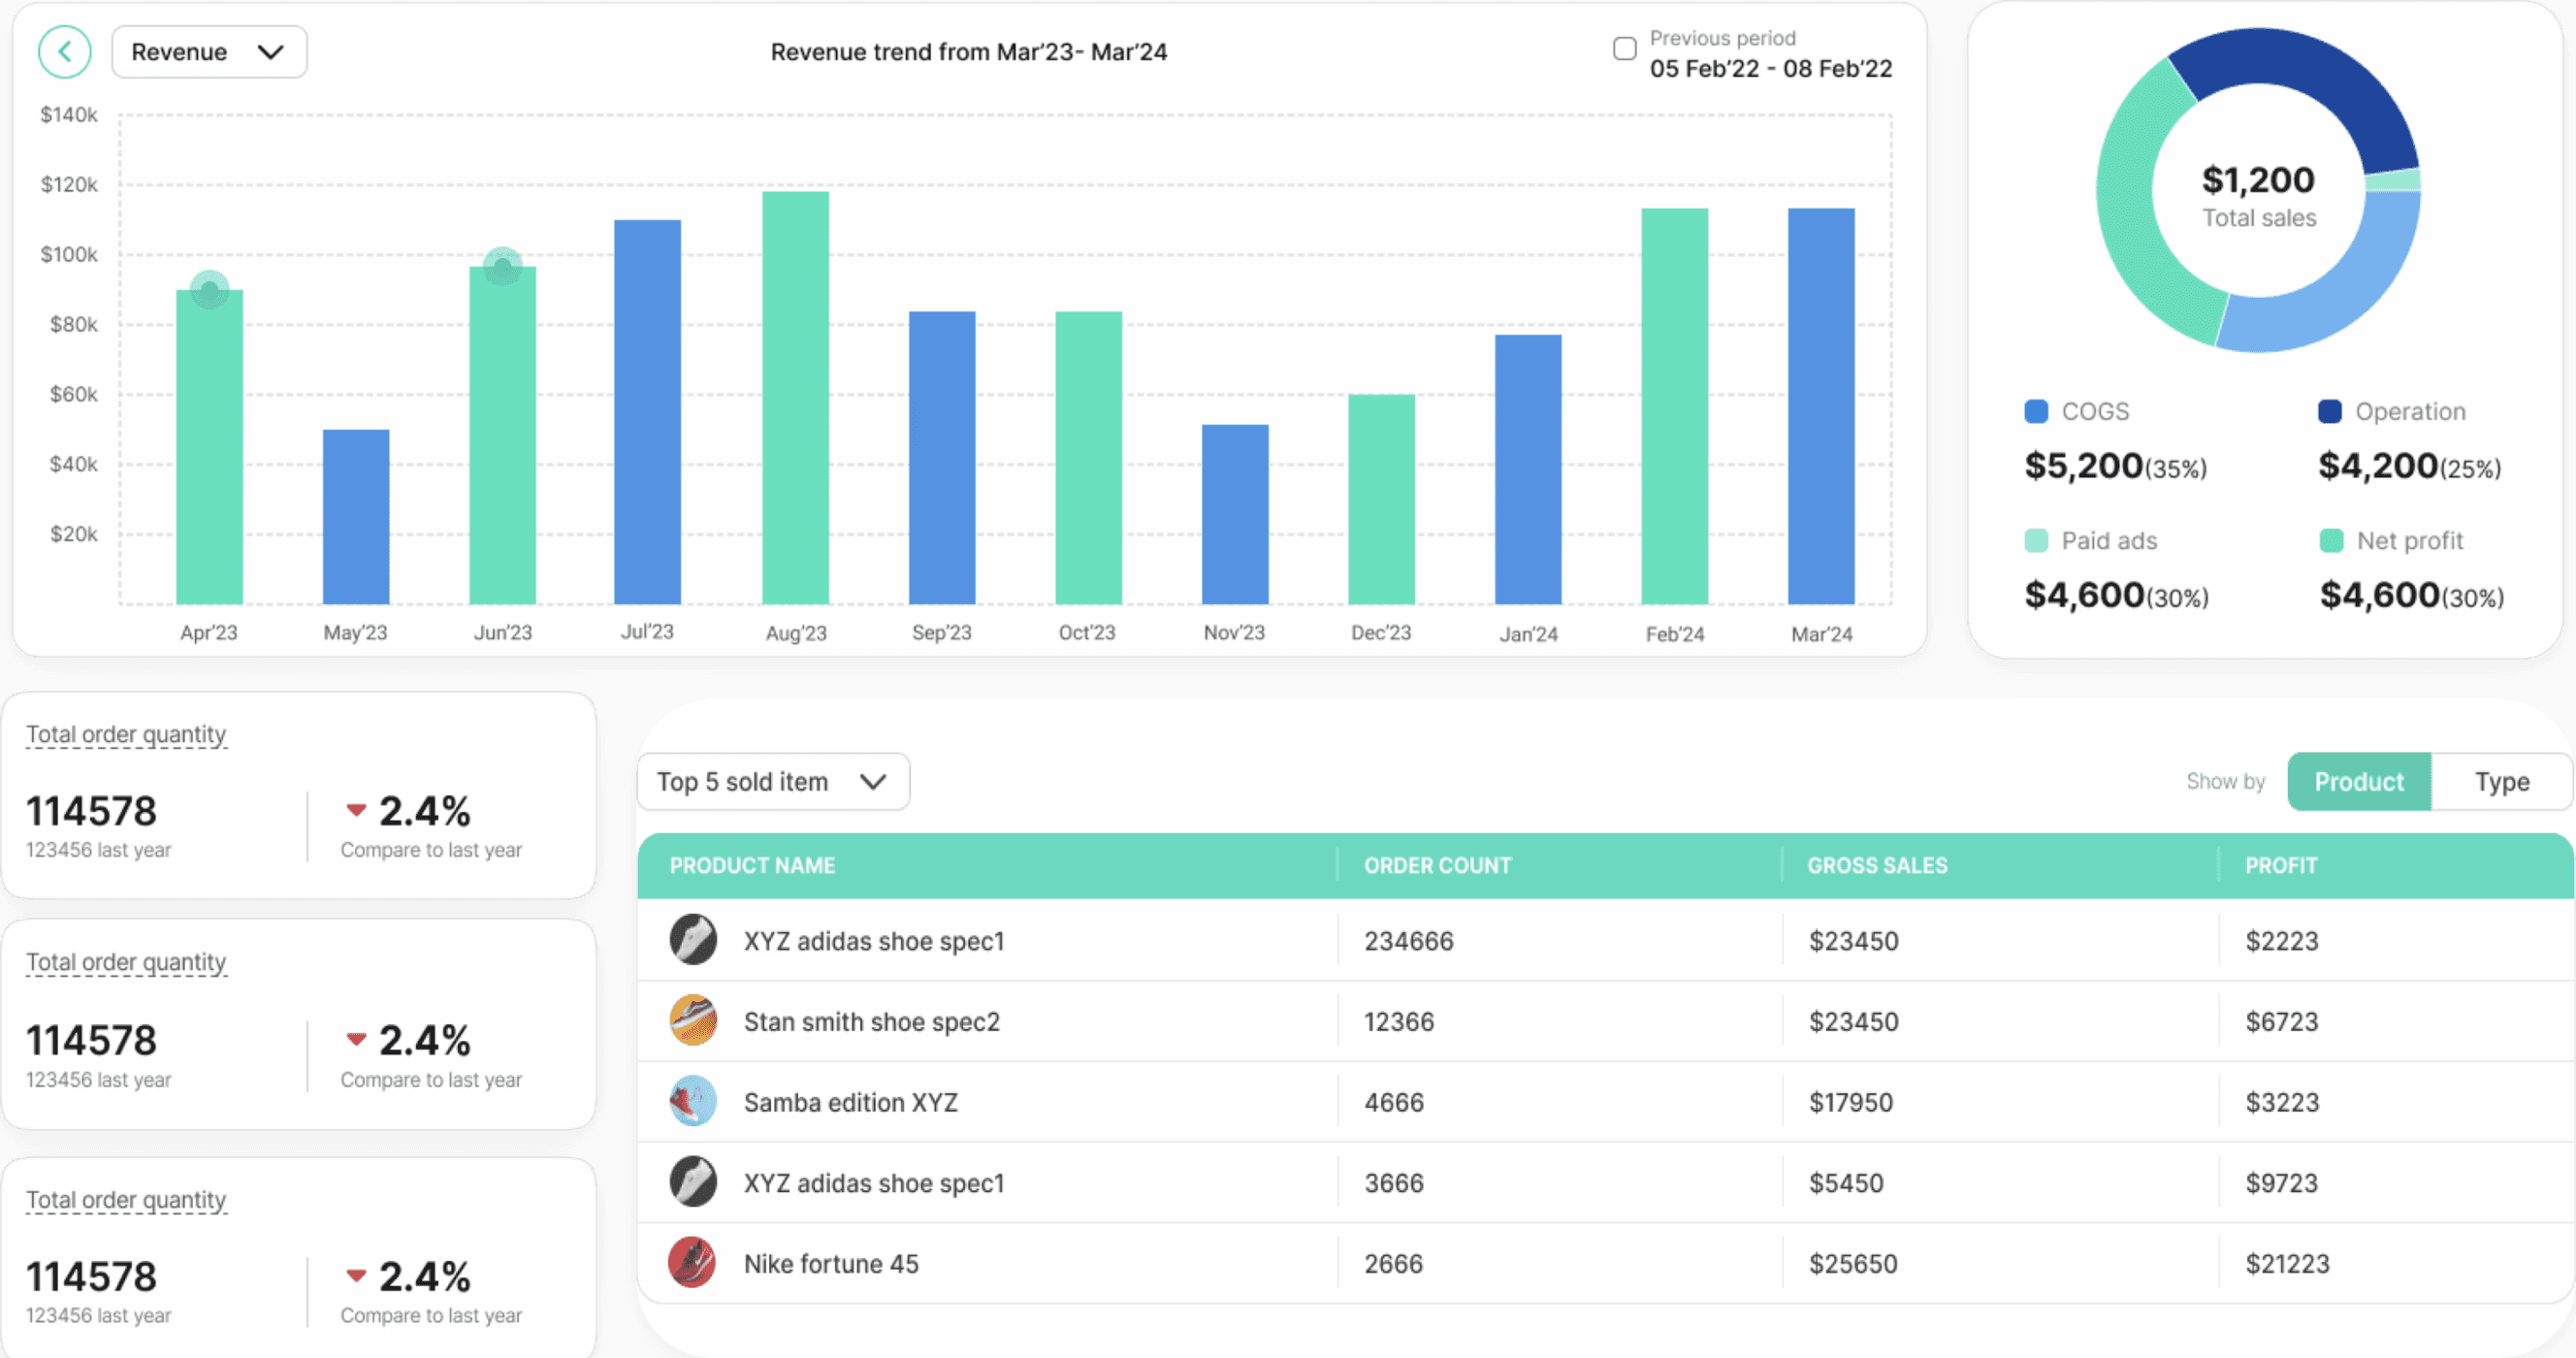
Business Insights,
Aggregated in One Place
The big picture or minutiae, Bloom’s 360º View and My Metrics lets you customize your dashboard to track the details that matter most.

Snapshots
Quick reads on profit, marketing & customers in the 360° View.

Custom Metrics
Select from 150+ KPIs to track what fuels profit.

Widgets & Charts
Visualize trends in a click no BI team required.

Profit + Return Tracking
See ad spend’s exact impact on contribution margin.

Marketing & Customer Insights
Follow ROAS, POAS & LTV without switching tabs.

All Data, One Dashboard
Faster decisions with every key number side-by-side.