How to Find Real ROI of Klaviyo Campaigns and Flows in Shopify
Klaviyo shows revenue from every campaign and flow. But after COGS, discounts, and refunds, is any of it actually profitable? Here's how to find out.

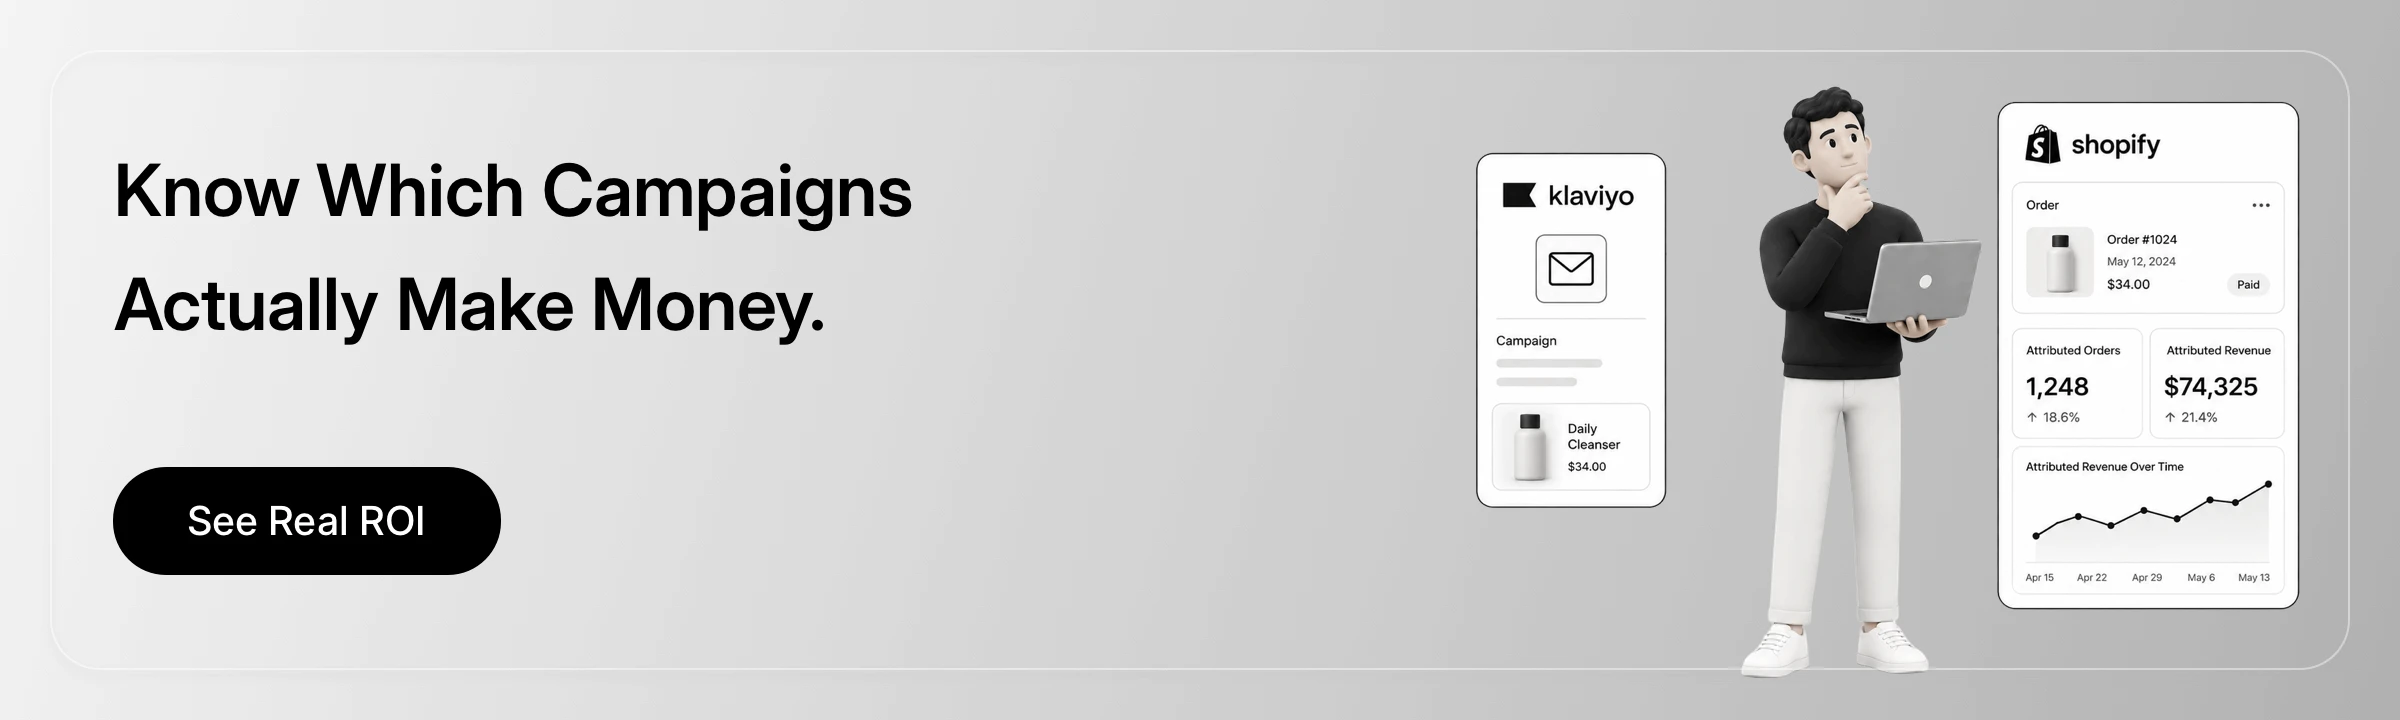
Your abandoned cart flow just attributed $12,400 in revenue last month. Your welcome series added another $8,200. Klaviyo is green across the board.
So why does your bank account tell a different story?
Because Klaviyo measures what it can see: orders placed within its attribution window. It does not see your COGS, your 30% discount code that drove half those orders, or the $1,800 in refunds that came through a week later.
Revenue is the starting line, not the finish line. For Shopify merchants running serious email and SMS programs, the only number that matters is what's left after everything.
TL;DR
Klaviyo attributed revenue counts orders, it does not subtract your product costs, fulfillment cost, discounts, or refunds.
A campaign can show strong revenue and still produce near-zero (or negative) profit margin.
The formula that matters: Campaign Profit = Revenue - COGS - Fulfillment - Discounts - Refunds.
Campaigns driving below 18% gross margin are burning more than they earn. Above 30% is sustainable.
Bloom connects Klaviyo campaign data to true profit, so you can see which flows are working and which ones to fix or kill.
What Klaviyo Actually Measures (And What It Doesn't)
Klaviyo is one of the best email and SMS platforms for Shopify stores. Its segmentation, automation, and deliverability are legitimately excellent. The revenue attribution it provides is also genuinely useful, as a starting point.
Here's how it works: when a recipient opens or clicks an email and places an order within Klaviyo's attribution window (up to 5 days for opens, 1 day for clicks by default, extendable to 30 days), that order revenue is credited to the campaign or flow. You can see open rates, click rates, Klaviyo conversion rates, and revenue per recipient for every message you send.
That data tells you whether your emails are generating purchase intent. It does not tell you whether those purchases are profitable.
Klaviyo has no visibility into your COGS. It does not know that 40% of the orders in last month's flash sale used a discount code that wiped out your margin. It does not subtract the refunds that hit your Shopify store the following week. It reports the gross revenue number Shopify confirms, and it stops there.
For many merchants, that gap between reported revenue and real profit is where the money disappears.
The Real ROI Formula for Klaviyo Campaigns
Real ROI from a Klaviyo campaign is not a Klaviyo metric. It is a finance metric you need to measure to know if you are making returns for your efforts.
The calculation looks like this:
Campaign Profit = Revenue - COGS - Order Fulfillment - Discounts Applied - Refunds/Returns
That's it. But the implications are significant.
Take a real-world scenario that plays out constantly for growing DTC brands. A promotional campaign drives $900 in attributed revenue across 70 orders. Sounds healthy. But the product cost on those orders runs $450. The campaign used a 40% discount code, which cost another $360. Post-purchase refunds add up to $100.
That leaves $10 in profit on $900 in revenue. A 1.1% margin.
Klaviyo will show you a green dashboard. It will not show you the $10.
This is not a criticism of Klaviyo, Attribution and profitability are different problems. But merchants who run their email programs purely off Klaviyo's revenue numbers are flying partially blind. The clicks and conversion rates tell you what is resonating. The profit margin tells you what is sustainable.
How to Identify Underperforming Klaviyo Campaigns
The goal of Klaviyo analytics is not just to improve open rates or click rates. It is to improve campaign ROI, which means increasing the margin generated per recipient, not just the revenue.
When you look at your campaigns and flow through a profit lens, a few patterns become visible quickly.
Discount-heavy campaigns almost always underperform on margin. A campaign with a 25% coupon can drive excellent Klaviyo conversion rates while generating margins that would not be acceptable on any paid channel. The open rate looks great. The profit does not.
High-volume flows with low-quality recipient segments are expensive. If you are on a Klaviyo plan that scales with contact count, a large portion of your list may be generating zero revenue and zero margin. They cost you in platform fees and deliverability health without contributing anything back.
Klaviyo flow benchmarks can mislead. Klaviyo provides revenue-per-recipient benchmarks segmented by business size. These are useful directional indicators. But a benchmark for revenue per recipient says nothing about profit per recipient. A flow hitting the top quartile of revenue benchmarks while running a 12% gross margin is not a win.
A reasonable framework for evaluating campaign health by margin: below 18% gross margin is unsustainable for most DTC businesses running any meaningful volume. Between 18% and 30% is borderline, worth monitoring. Above 30% is the zone where email and SMS actually compound into a scalable retention channel.
Why Klaviyo Conversion Tracking Alone Is Not Enough
Klaviyo conversion tracking is built to answer one question: did this message result in a purchase?
That is a valuable question. It is not the only question.
Conversion rate tells you how effectively your emails drive action. It does not tell you the quality of that action, whether the order had healthy margins, whether the customer used a discount code, or whether the product ended up being returned.
This is where Klaviyo analytics needs to be extended, not replaced. The conversion data Klaviyo provides is accurate and useful. What it needs is a profit layer on top: something that pulls in your COGS, maps discount usage per order, nets out refunds, and gives you a per-campaign and per-flow profit view.
Without that layer, you are optimizing for the wrong metric. You can improve Klaviyo conversion rates and watch margin erode at the same time, especially if you are leaning on discounting to drive those conversions.
Building a Klaviyo ROI Calculator That Actually Works
A Klaviyo ROI calculator worth using has four inputs:
Campaign revenue (from Klaviyo attribution)
COGS on attributed orders (based on Shopify product cost / COGS data )
Order fulfillment cost ( shipping, processing and gateway costs)
Discounts applied (discount code usage on those orders)
Refunds and returns (post-purchase, net restocking, including return costs)
The output is contribution margin, not revenue. That is the number you manage your email program by.
Most merchants do not have this sitting in a single dashboard. Klaviyo holds the revenue and conversion data. Shopify holds the order-level detail including discounts and returns. COGS lives in your supplier agreements or inventory management system or sometimes Shopify Dashboard.
Connecting those sources is the work. Once connected, you can rank every campaign and flow by true profit, flag the ones below your margin threshold, and make decisions about which promotions to retire, which segments to suppress, and where the program is actually building the business.
How Bloom Helps With Klaviyo Campaign Analytics
Bloom connects Klaviyo campaign and flow data to true contribution margin pulling in COGS, shipping cost, transaction fees, discounts, and refunds automatically.
Instead of manually cross-referencing Klaviyo exports with Shopify order data, Bloom does the connection for you. Every campaign and flow gets a profit view: revenue, margin percentage, cost breakdown, and a plain-English label telling you whether the campaign is a strong performer, a borderline case, or a margin drain.
The recipient-level profit analysis Bloom provides is particularly useful for email list hygiene decisions. If a large segment is generating attributed revenue but negative contribution margin because of discount behavior and return rates, Bloom flags it directly.
Bloom also surfaces the campaigns and flows where your margins look healthy, so you know what to scale and what to replicate in future sends.
If you are running Klaviyo email marketing for Shopify and making decisions based on revenue alone, the profit layer is the missing piece. Bloom adds it without requiring any manual data work.
Install Bloom in two minutes and see your Klaviyo campaign margins by tomorrow morning.
FAQ
What is Klaviyo attributed revenue and why doesn't it show profit?
Klaviyo attributed revenue is the total order value from purchases made by recipients within a set attribution window after opening or clicking an email or SMS. It reflects gross order value only. Klaviyo has no visibility into your product costs, discount codes applied at checkout, or post-purchase refunds, which means the revenue figure consistently overstates the actual profit generated by a campaign.
What is a good ROI benchmark for Klaviyo campaigns?
A useful benchmark for Klaviyo campaign ROI is contribution margin per campaign, not revenue per recipient. A gross margin above 30% after COGS, discounts, and refunds is sustainable. Between 18% and 30% is marginal and worth monitoring closely. Below 18% is a signal to investigate the discount strategy, product mix, or recipient segment driving that campaign.
How do I identify underperforming Klaviyo campaigns?
Filter campaigns and flows by contribution margin, not revenue or conversion rate. High-volume campaigns with heavy discount usage often underperform on margin even when Klaviyo conversion tracking shows strong results. Campaigns with above-average return rates are another common culprit. Sorting by true profit rather than attributed revenue will surface the underperformers quickly.
Why is my Klaviyo conversion rate high but my profit low?
A high Klaviyo conversion rate tells you the email drove purchases. It does not tell you whether those purchases were profitable. The most common causes of high-conversion, low-margin campaigns are: aggressive discount codes that reduce per-order margin, product mix skewed toward lower-margin SKUs, and high return rates on the orders that are converted. Improving ROI means addressing the margin quality of conversions, not just the conversion volume.
What should I include in a Klaviyo ROI calculator?
An accurate Klaviyo ROI calculator needs four inputs: campaign-attributed revenue from Klaviyo, COGS on the attributed orders, total discount value applied across those orders, and refund amounts net of restocking. The output is contribution margin in dollars and as a percentage. Revenue per recipient, which is the metric Klaviyo surfaces natively, is a useful proxy but not a substitute for this calculation.
How do Klaviyo flow benchmarks compare across business sizes?
Klaviyo provides revenue-per-recipient benchmarks segmented by annual revenue tier, which give a directional sense of how your flows compare to similar-sized merchants. These benchmarks are revenue-based, not profit-based, so a flow performing above benchmark on revenue can still be generating poor margins if discount usage or return rates are elevated. Use benchmarks as a directional check, not a definitive measure of flow health.
Know Your Real Profit And
The Ads That Actually Sell.
No need to spend. Just try it on your store.


