Best Methods to Calculate Profits in Shopify Stores
Measure Shopify profits the easy way. Learn how to analyze product, order, and daily profits to optimize costs, improve sales, and boost margins over time.

Store profits show up as an overall profit number; but they are the result of many smaller profit wins working together. While the ultimate goal is to have a sustainable profit, it’s just as important to look at profits across different operations and time periods to see exactly where money is being made or lost, and why. Because, behind every “profit” figure lies deeper questions: Are your products actually profitable? Are orders profitable? How much margin survives after marketing, fulfillment fees and operating expenses? Is the business improving with regard to previous periods?
To clearly understand what’s working and what’s not, let’s analyze profits from different perspectives : Overall Business profitability, product profit and order profit. While many other frameworks may exist depending on your goals and business model, these three essential lenses provide the most practical and actionable view of what drives your bottom line and how to optimize business from the ground up.
Calculating Shopify Business Profitability
Ultimately, profitability comes down to one principle: you must account for every dollar that comes in and goes out the entire operation. This requires a structured breakdown of financial layers such as Total Revenue, Gross Profit, Contribution Margins, and Net Profit. Each layer deducts a specific group of costs: product cost, fulfillment expenses, marketing spend, and operating expenses to reveal a deeper and more accurate level of profitability.
When you lay these line items out in sequence, the path from total revenue to net profit looks like this:
GMV (Gross Merchandise Value) = (Product Price * Quantity Sold)
Gross Revenue = GMV - Discounts
Net Revenue = Gross Revenue - Refunds - Tax + Shipping Revenue
Gross Profit (CM1) = Net Revenue - Product Cost
Contribution Margin 2 = Gross Profit - Shipping Cost - Handling Cost - Tariff Cost - Payment Processing Fees
Contribution Margin 3 = CM2 - Ad Spend
Net Profit = CM3 - Operating Expenses
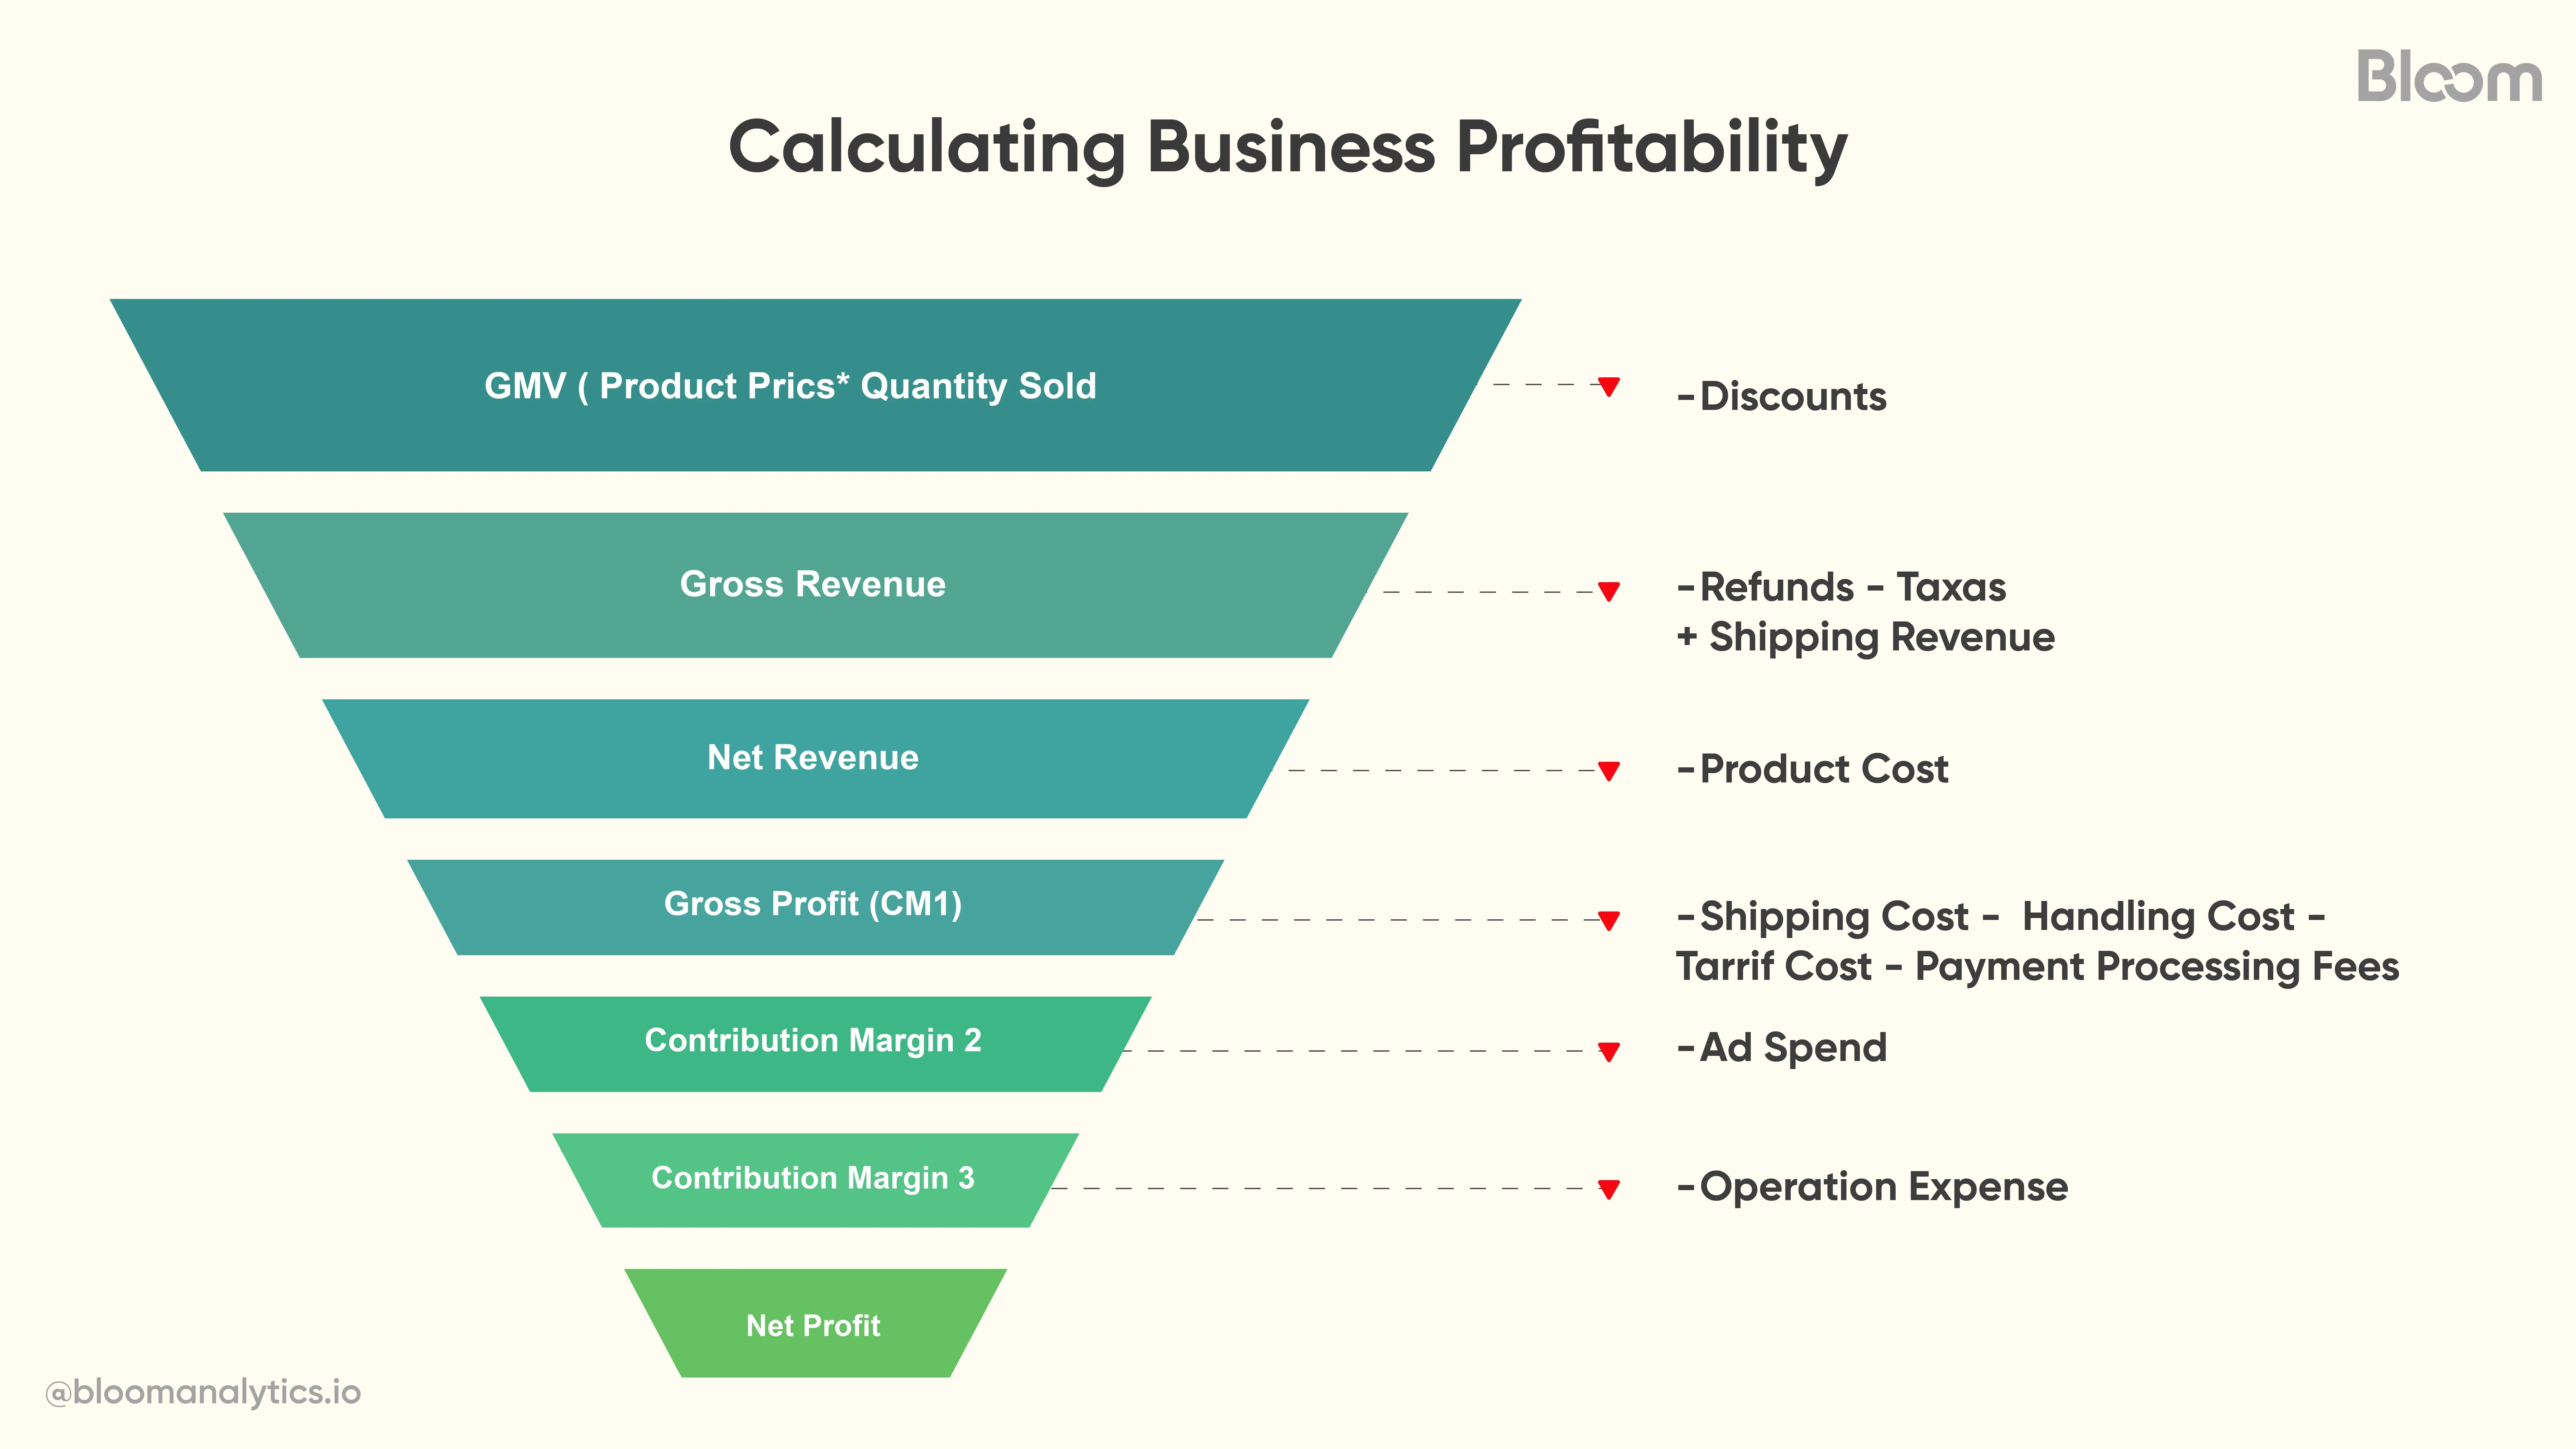
Here, you can see how each line item influences revenue and how much of that margin is contributing to net profit at each stage. This helps you identify and eliminate inefficiencies at the earliest stage possible.
But sometimes, even a strong Net Profit number cannot save your business. Beneath that perfect-looking figure, margins may be slowly dying as costs rise faster than revenue. It’s a ticking bomb in e-commerce and the danger stays hidden until it becomes difficult to reverse.
So how do you deal with it?
Get down to the product and order level profits and you will know exactly which sales are actually making you money!
Calculating Profit Margins of Products
“This is how much money I made” becomes irrelevant if you can’t explain which products actually made you that money.
Even global giants like Apple learned this the hard way when iPhone margins began to shrink. Despite selling millions of iPhones, their profits were thinning, from over 40% to below 35%. They fixed it by doubling down on product-level profits. Controlled production costs, introduced multiple product tiers to serve more customers, offered high-margin accessories (watch, Air Pods), and expanded into services (streaming & subscriptions) with far higher margins than hardware.
The result? Gross margins rebounded to 43.5%. That’s the power of understanding how, and which products can truly drive profit.
Product profitability analysis helps identify which SKU or group of SKUs in your catalog are contributing significantly to the company's net profit.
At the product level, which costs can you actually track? Here’s the real challenge!
Only certain costs can be directly tracked at the product-level. Discounts, refunds, and any ad spend linked to those specific products are easy to attribute, but some costs sit at the order level (like shipping) or even the business level (like operational costs). Still, analyzing the costs you can track can give a solid level of accuracy, more than enough to guide product decisions.
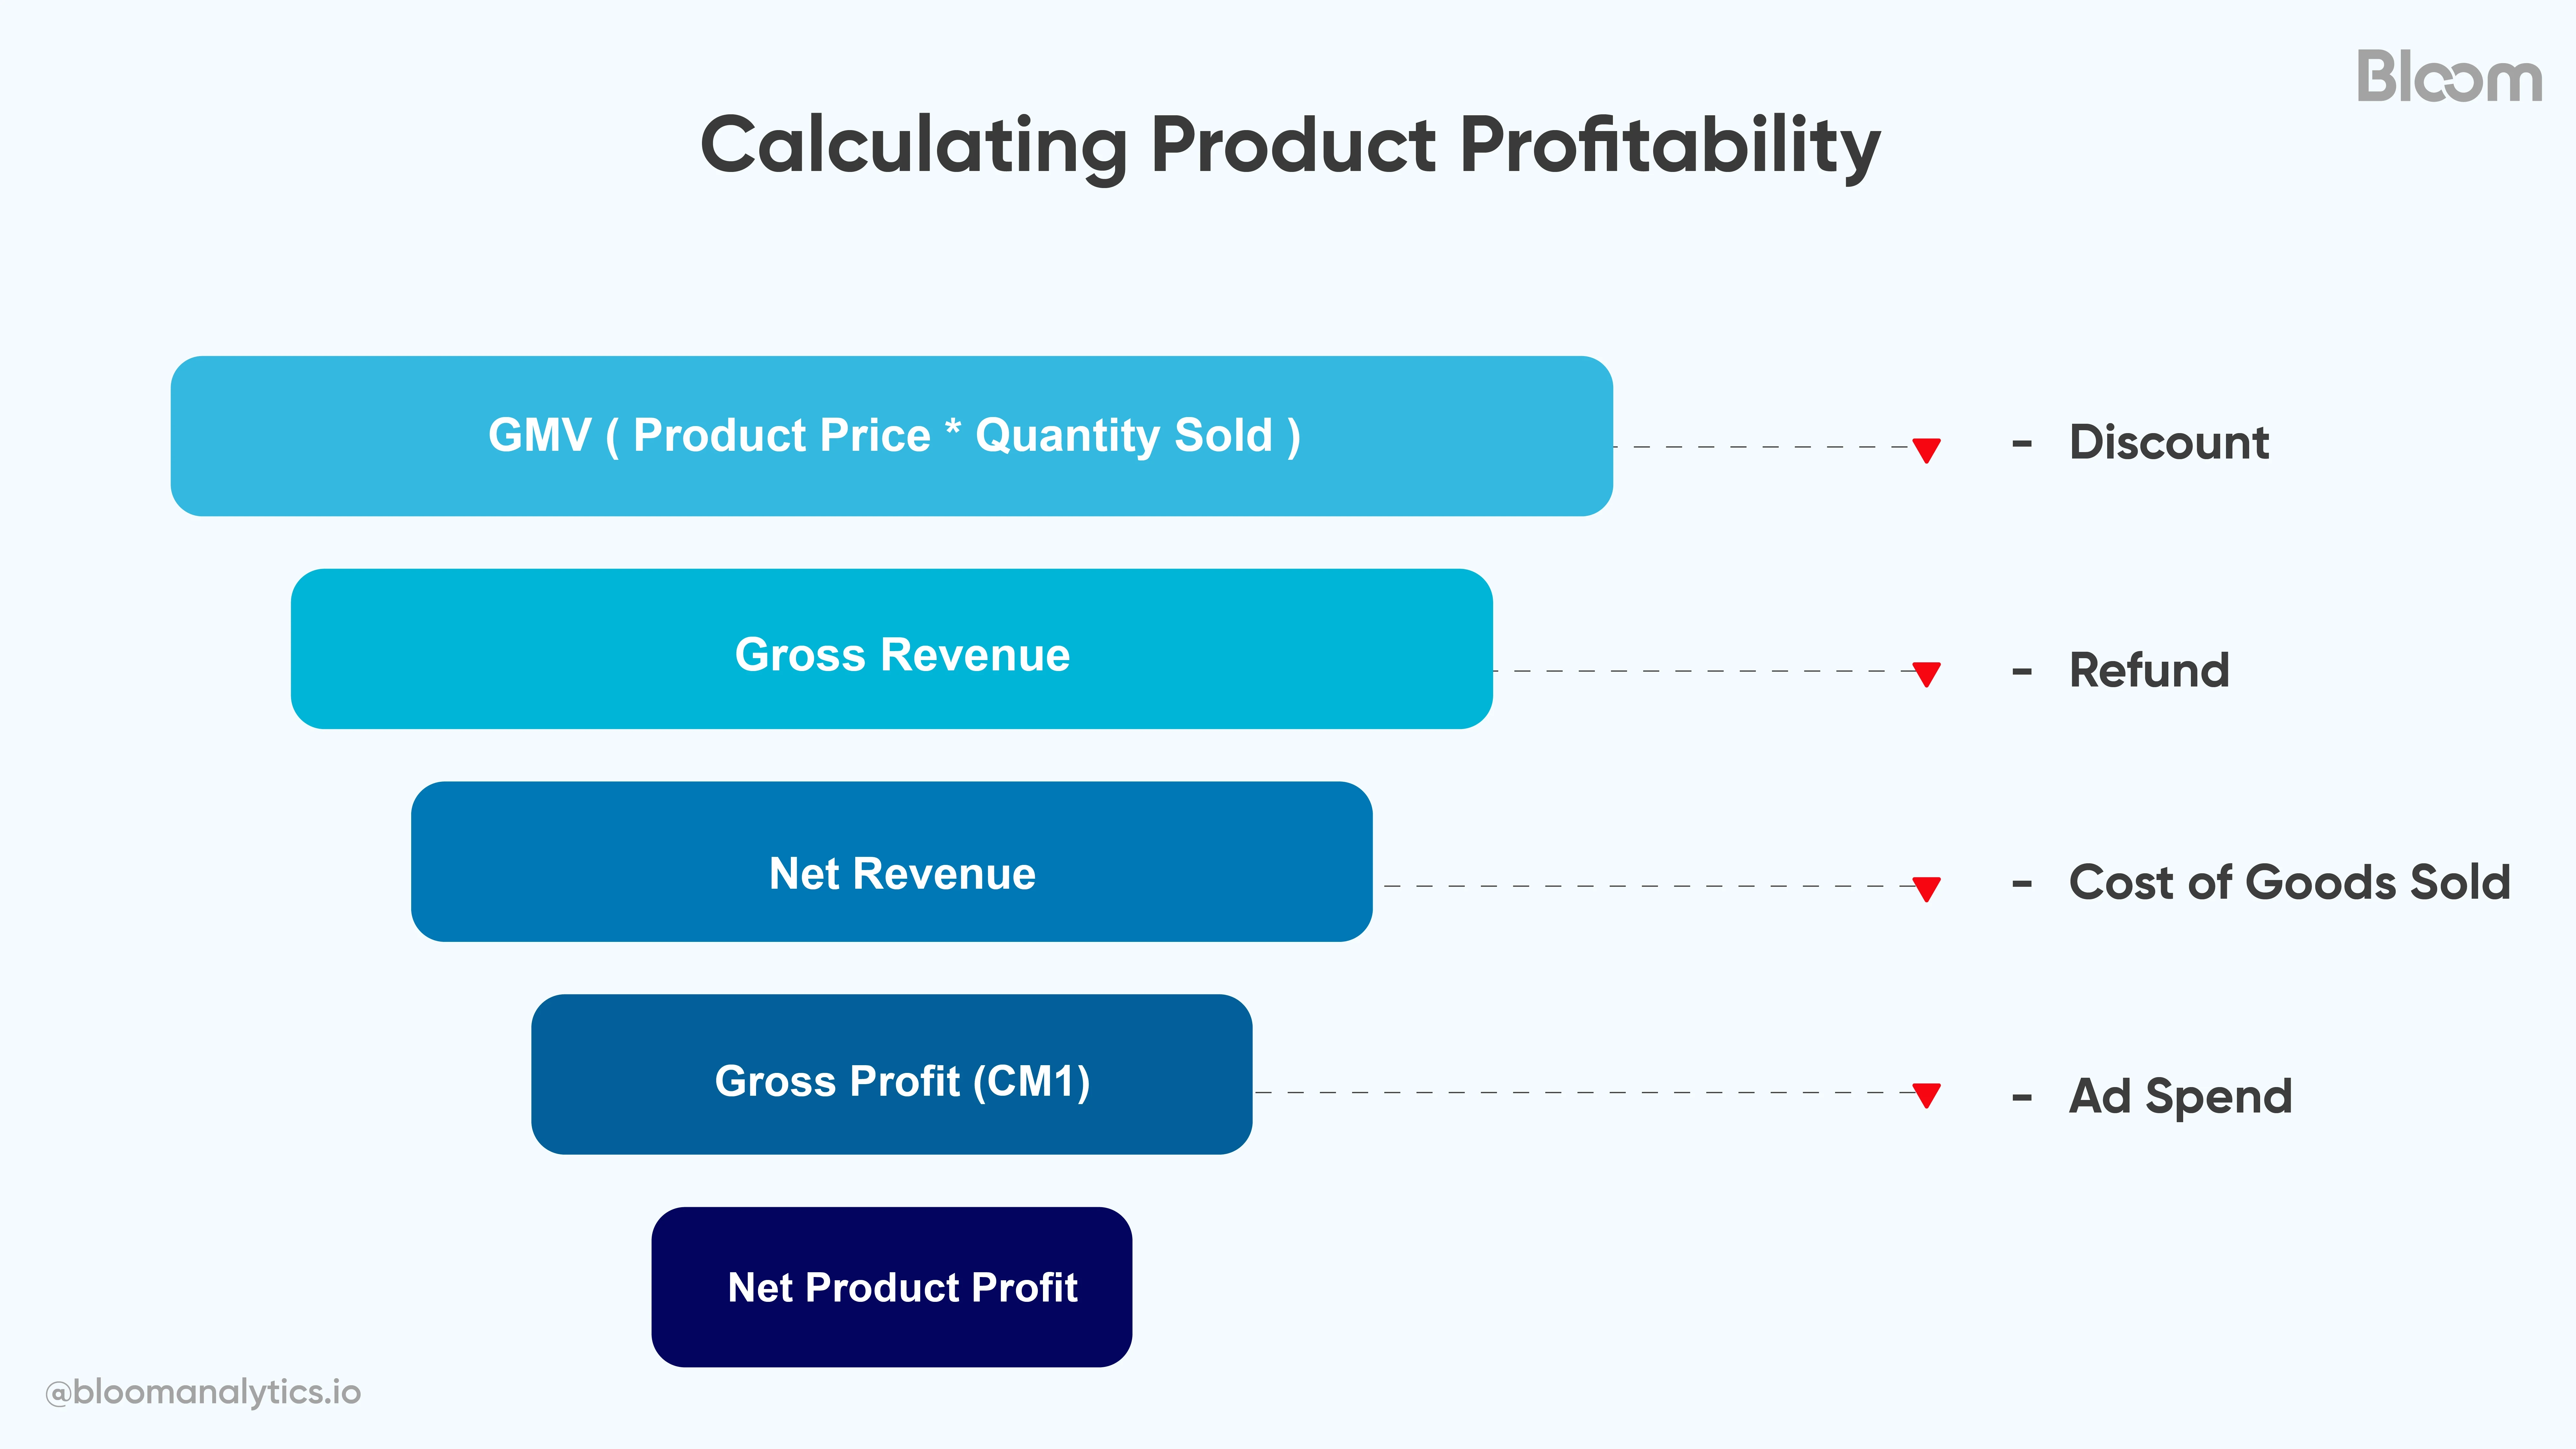
Here is a step-by-step breakdown of costs you can track and how those costs roll up into net product profit:
Gross revenue = GMV - Discount
Net revenue = Gross Revenue - Refund
Gross profit = Net Revenue - Cost of Goods Sold
Net product profit = Gross Profit - Ad spend
Focus on the cost drivers in each line item and figure out how you can optimize them for better margins.
Benefit of Breaking Down Total Profit by Product
A strong product choice delivers healthy margins and sustainable profits, only when it’s priced, positioned and marketed effectively. Product-level insights,
Helps you scale profitable products and confidently phase out underperforming ones.
Helps you focus your marketing on products with the highest potential for better returns.
Aids in pricing decisions by understanding the COGS involved.
Helps you see whether you can afford to discount when margins are already tight.
Highlights products that consistently disappoint customers and result in higher return rates.
Once you understand where line items can be controlled, pricing and cost decisions become more strategic, ultimately improving margins.
Shopify Order Profit Analysis
What if the problem isn’t your products, but the way orders are structured?
Product margins alone can look good, but once it becomes part of an order, profitability can shift for the better or worse.
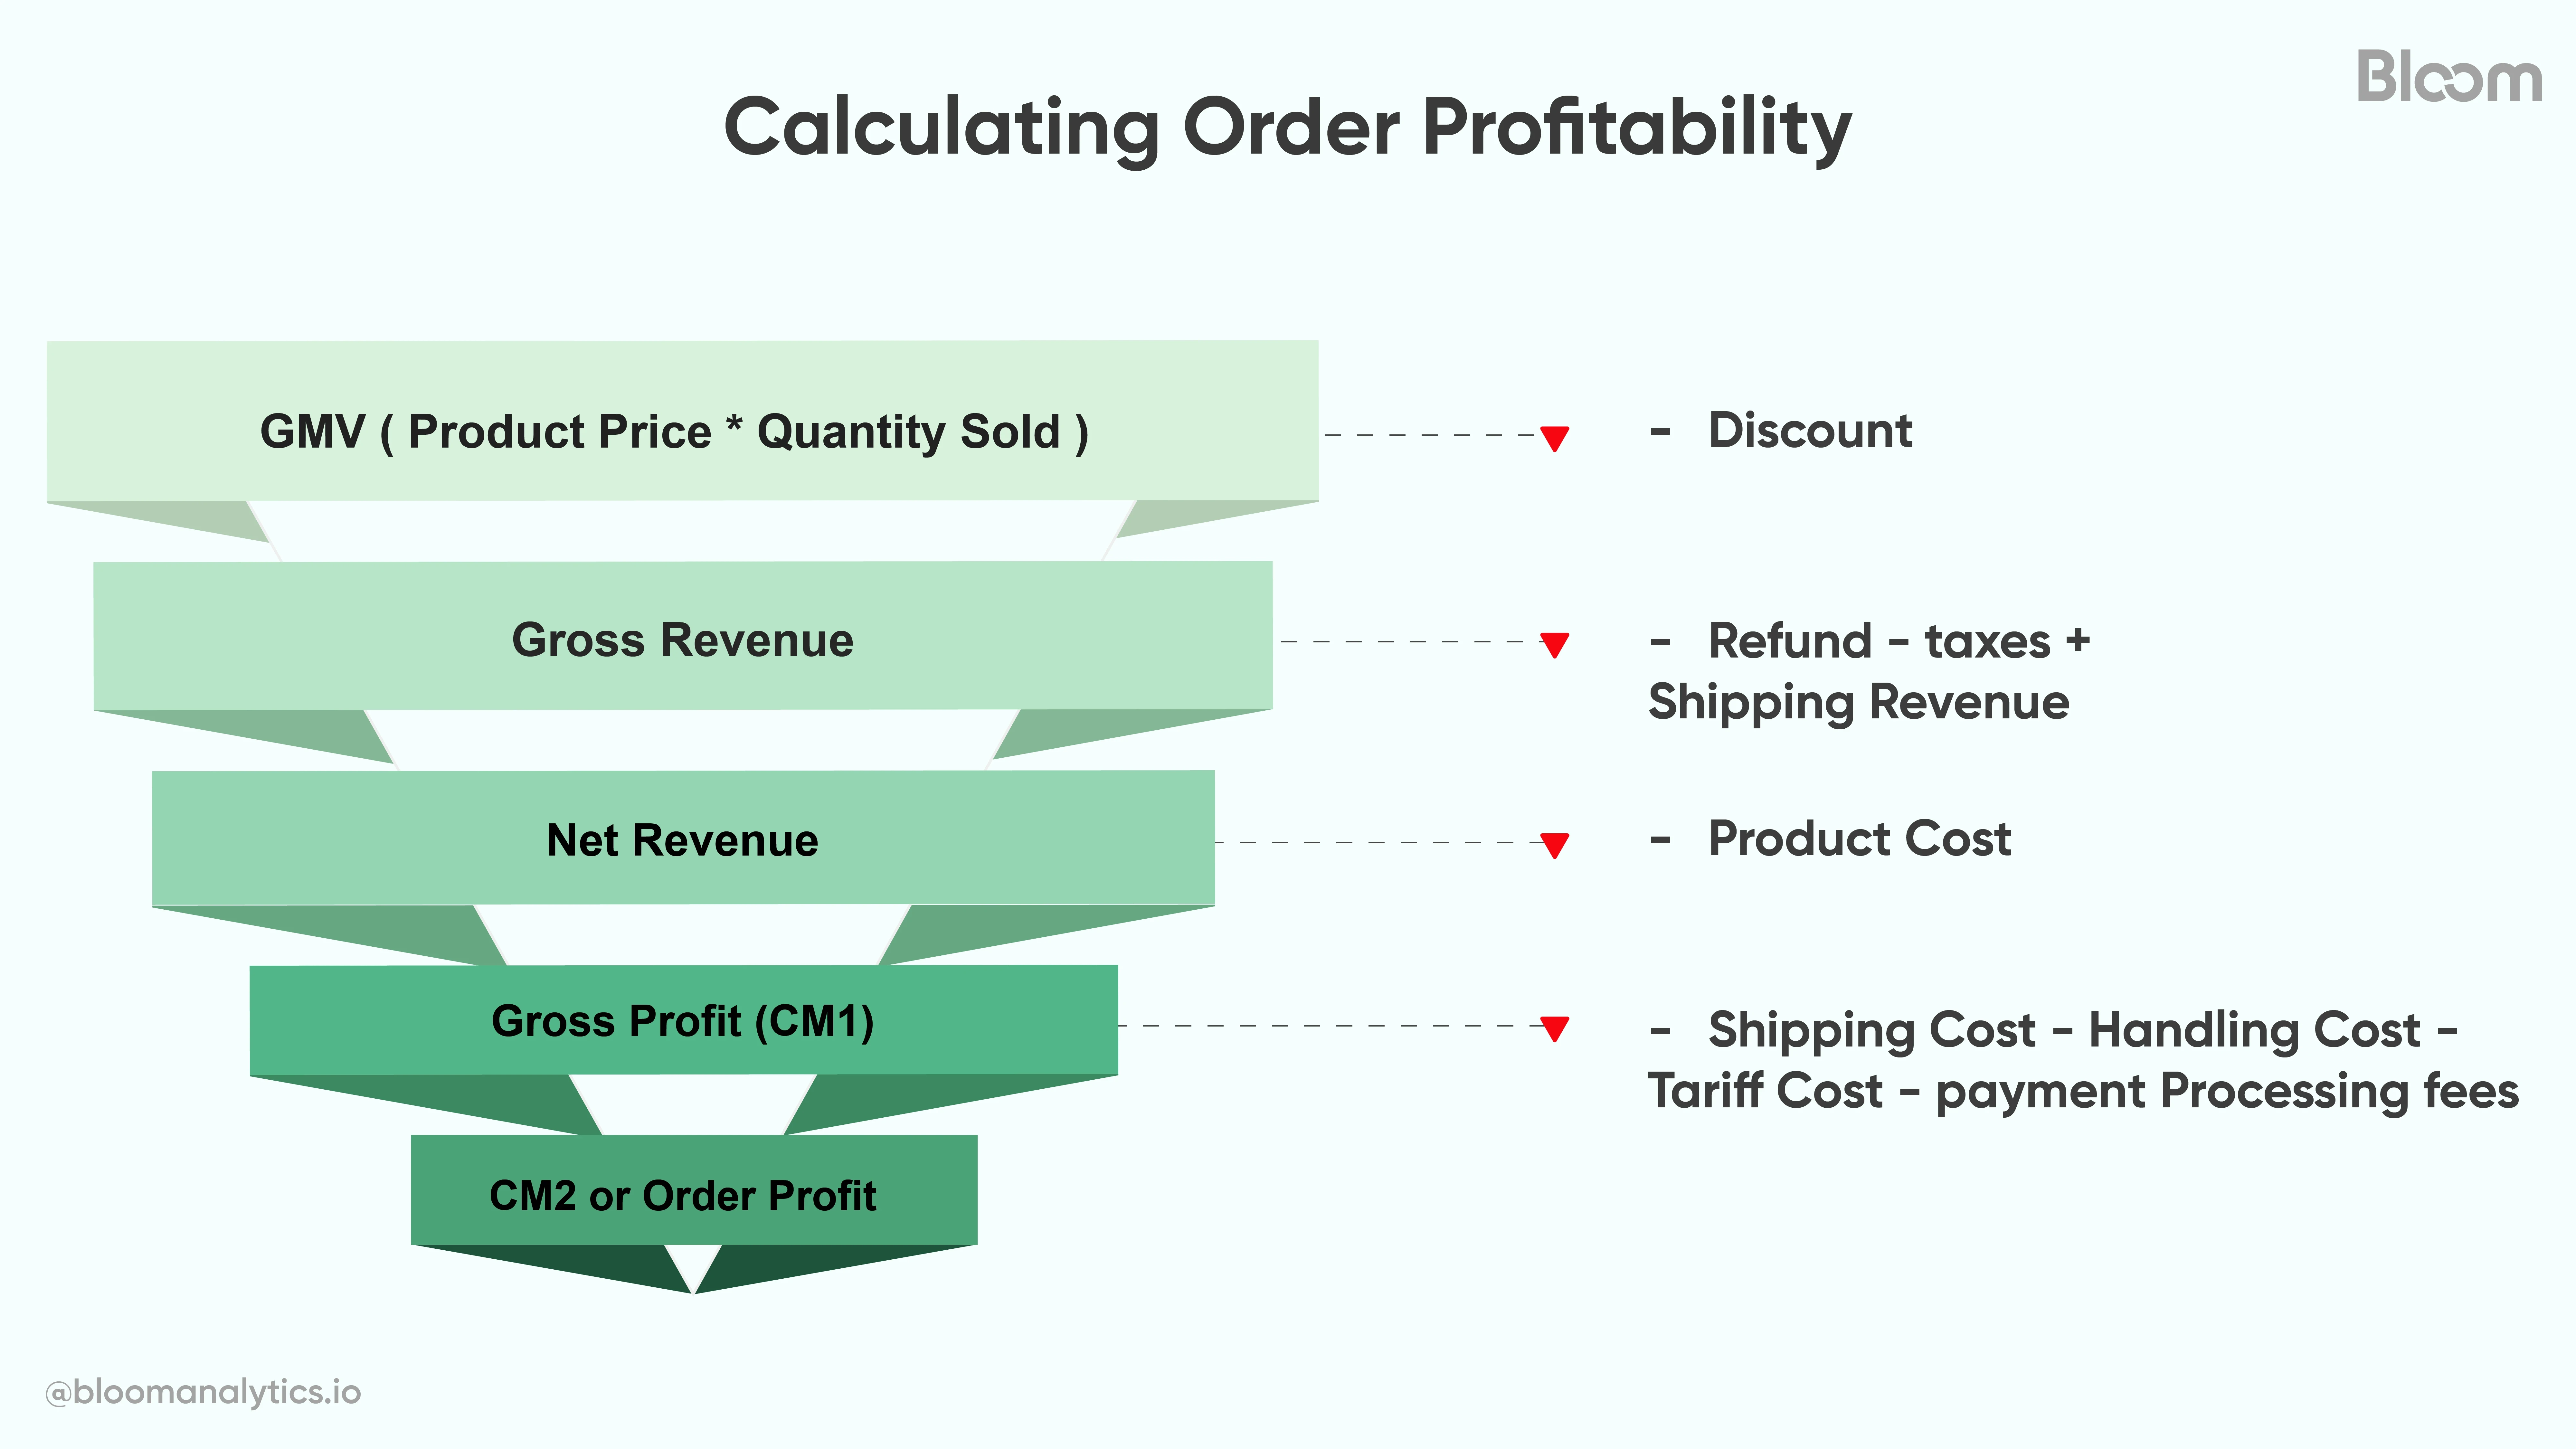
Order-level visibility shows the real profit you earn per sale, revealing how much every order contributes (or fails to contribute) to your bottom line. It points out product combinations that become unprofitable when paired together and also exposes costs that product-level analysis alone can’t capture, like: shipping, handling, tariff charges, payment processing fees, taxes, and shipping revenue. This added insight influences smarter decisions around third party logistics, fulfillment and transaction fees.
Gross Revenue = GMV - Discounts
Net Revenue = Gross Revenue - Refunds - Taxes + Shipping Revenue
Gross Profit (CM1) = Net Revenue - Product Cost
CM 2 or Order Profit = Gross Profit - Shipping Cost - Handling Cost - Tariff Cost - Payment Processing Fees
What can Go Wrong in Order Level profits?
Even when sales look strong, certain individual expenses can quietly go overboard, making it harder for revenue to cover per-order costs. For example,
Offering free or underpriced shipping that does not cover actual fulfillment costs
High packaging, handling, or third party service fees for shipping
Excessive discounts that reduce order value and shrink profit margins
Frequent refunds that reverse revenue but leave hidden costs behind
High transaction fees from certain payment methods
Inefficient product bundling where combinations that look profitable actually lose money due to added costs
How this analysis help optimize the cost inefficiencies?
Most order level profit issues can be resolved by optimizing the specific line items that are pulling your margins down. For example, you may need to negotiate better rates with payment providers and shipping carriers, improve product quality to reduce refunds and discounts, be mindful of the discount codes and offers applied at the order level, and reevaluate bundle pricing by analyzing combined costs to ensure each bundle stays profitable. When these adjustments are made with the right insights, they can significantly improve your overall margins.
Track Profit Trends to Identify Patterns and Turning Points
One month, the profit strategy kills it. Overnight, the same approach starts burning cash. Seasonal spikes, platform fee hikes, shipping delays, or new contracts can flip profits real fast.
That’s why it’s important to regularly track profit trends over time. It’s the only way to catch rising costs early and sustain long-term profitability.
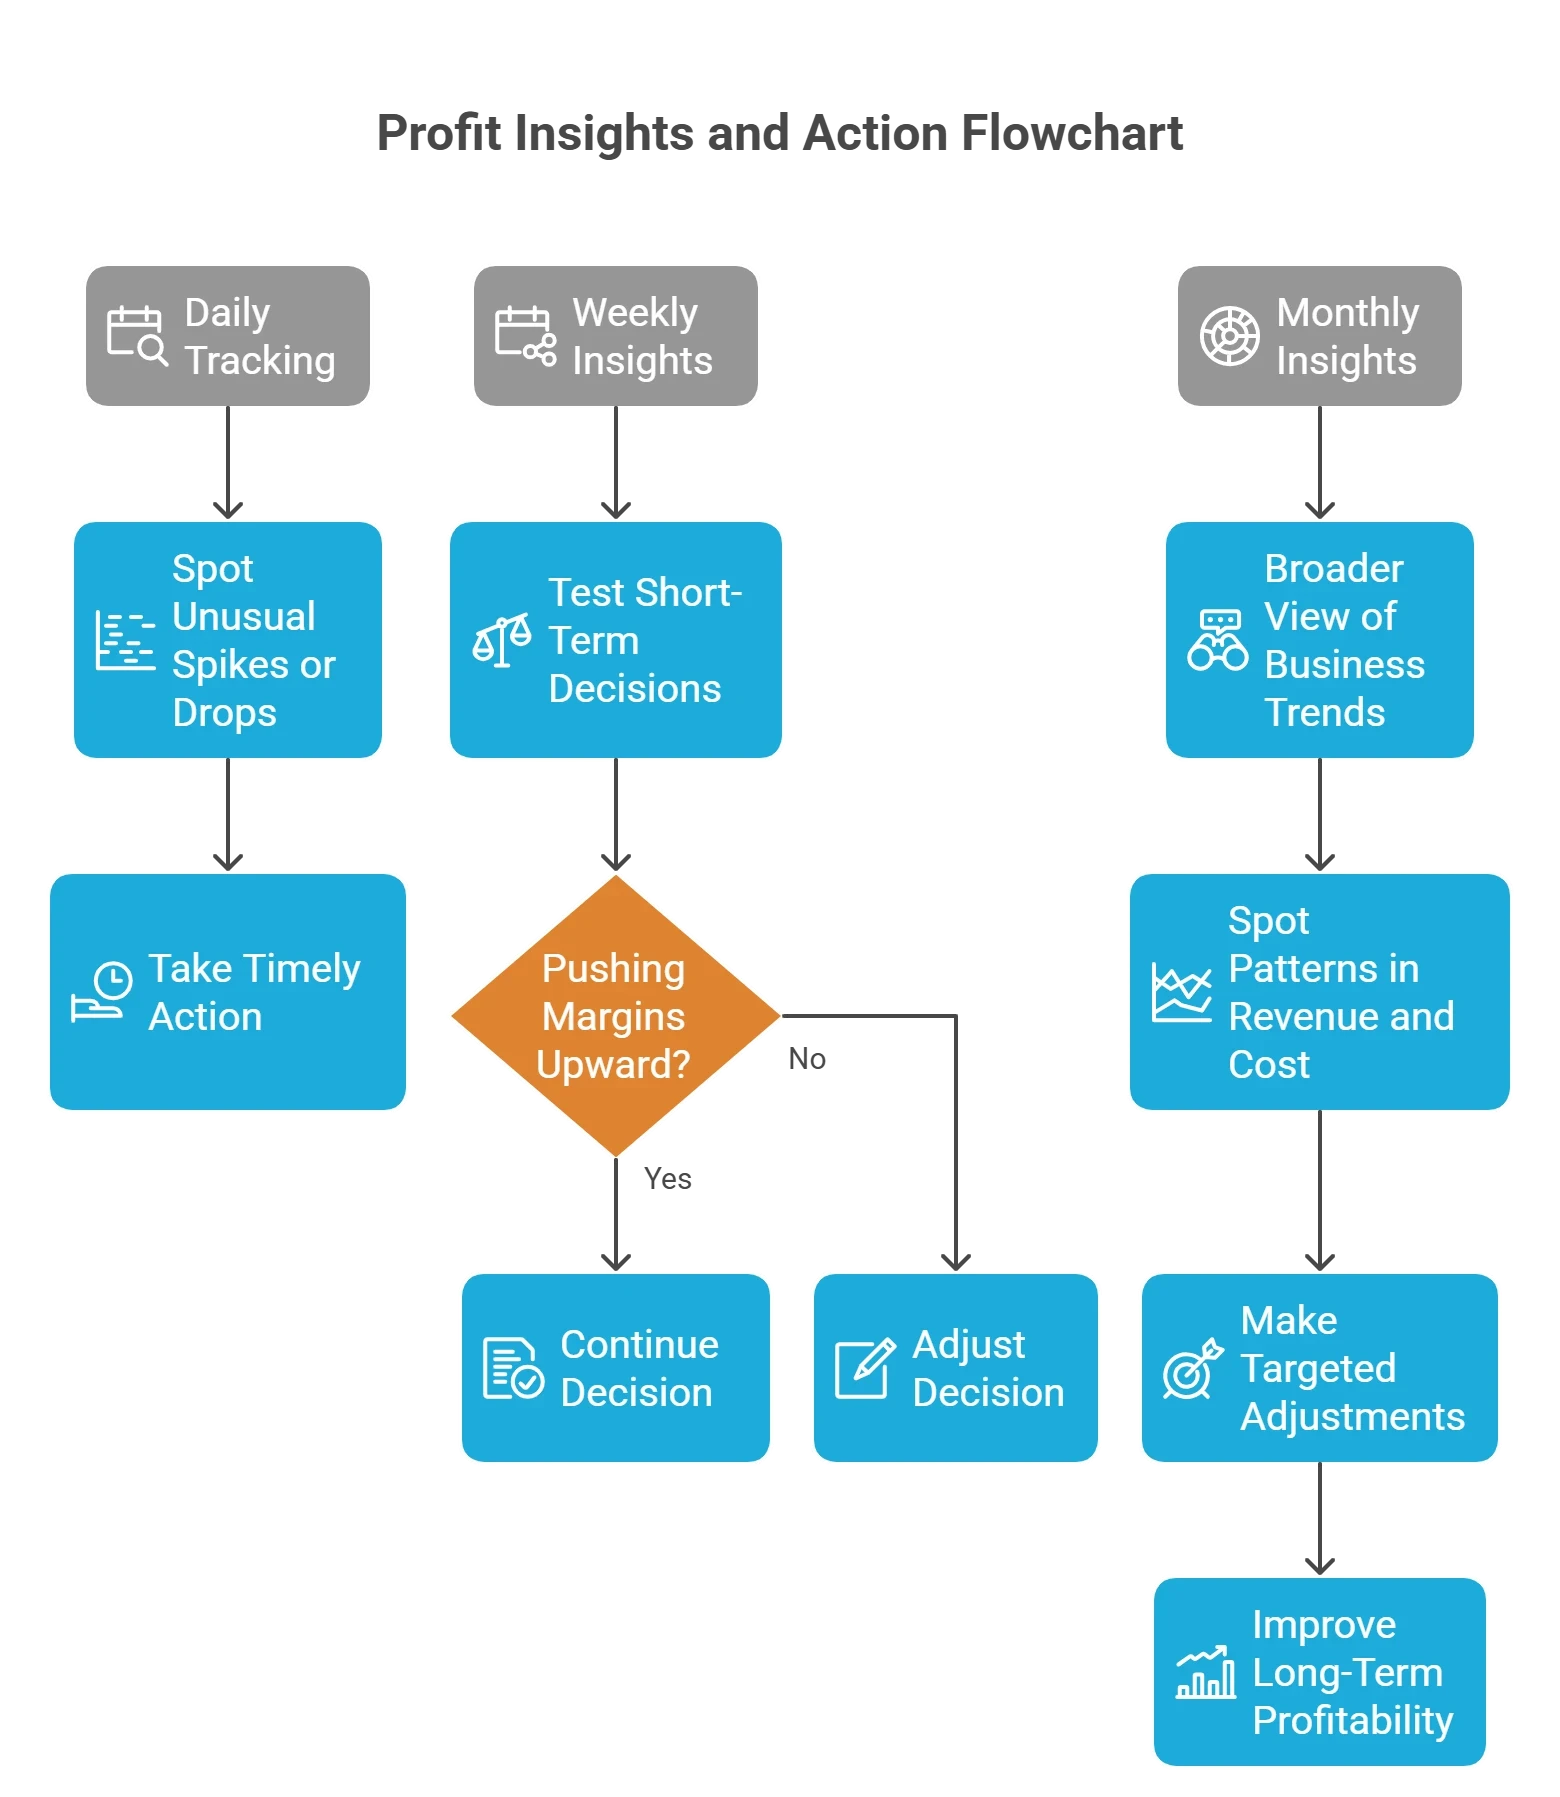
Daily tracking gives you an immediate snapshot of the store’s general health. You can quickly spot unusual spikes in costs or sudden drops in margins and take timely action.
Weekly insights helps to test the impact of short-term decisions without risking margins; new shipping contracts, pricing tweaks, or campaign retargeting to see if it’s pushing margins upward or in the wrong direction.
Monthly insights gives a broader view of how the business is trending on profit performance. Since, it shows a complete breakdown of revenue and cost layers, it's easier to spot patterns about which line items are contributing less to the net profit and make targeted adjustments to improve long-term profitability.
Conclusion
Every ecommerce business needs to understand how profits are distributed across its operations. The idea is simple. When you invest significant resources into sourcing products, fulfilling orders, and supporting them, you don’t want those efforts to be wasted by sales that don’t contribute to your bottom line.
Reviewing key profit margins separately helps you spot and fix inefficiencies right where they occur. Tracking them regularly over time prevents losses from growing and keeps your bottom line consistently healthy.

Know Your Real Profit And
The Ads That Actually Sell.
No need to spend. Just try it on your store.