Best Ecommerce Profitability Dashboard Tool for Shopify Brands
Outgrowing Shopify’s dashboard? Learn how advanced reporting dashboards turn revenue, ad spend, and costs into clear insights on profit and growth.

Most Shopify merchants do not want to start their day digging through reports. They just want a quick pulse check on how the store is doing. The default Shopify Dashboard does help with that to an extent, surfacing metrics like sales, traffic and customer behaviour upfront.
But even simple questions like comparing performance across marketing channels or understanding how efficiently you’re generating revenue often takes a few extra clicks inside Shopify Analytics. Over time, this friction adds up, and many merchants turn to spreadsheets or paid apps for deeper insights.
This gap between what’s easily accessible and what’s actually needed is where the default Shopify analytics dashboard starts to fall short. As stores scale, merchants need dashboards that don’t just display data, but make key insights instantly visible and easy to act on.
We’ll break down what Shopify Analytics provides, where it limits growing brands, and what to look for in a better ecommerce profitability dashboard tool.
What the Shopify Dashboard Shows
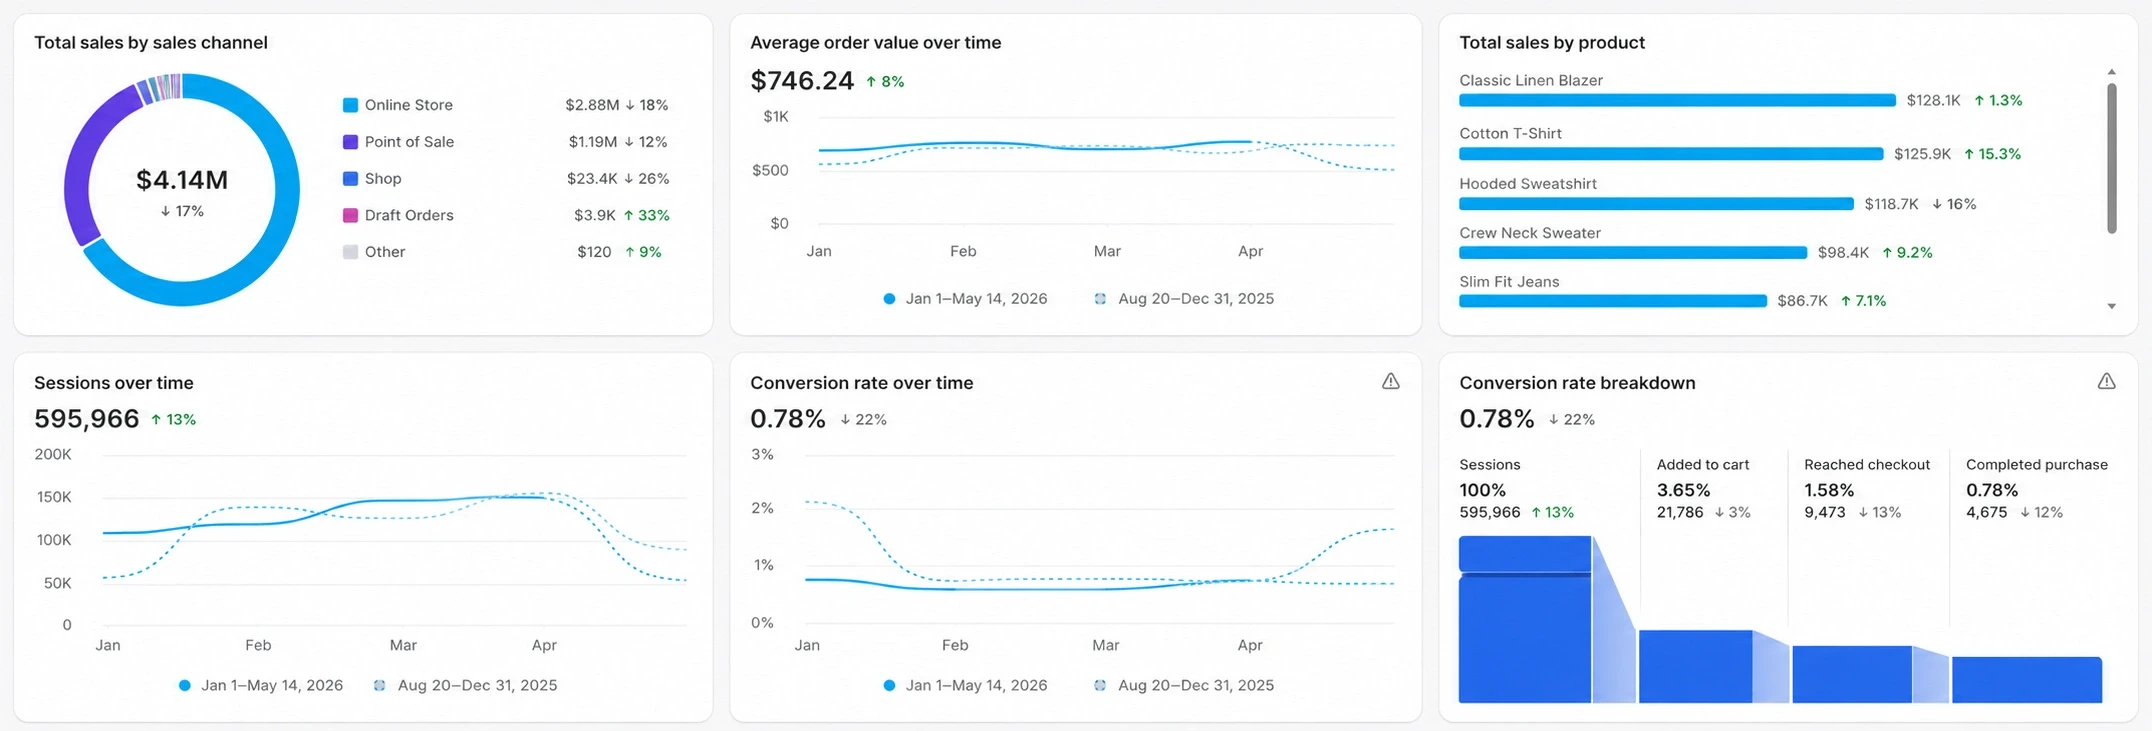
The Shopify Dashboard is designed to give merchants a quick, high-level view of store performance. Right from the homepage, it surfaces key metrics that help you understand how your store is doing at a glance.
At a basic level, you can see:
Total sales – your revenue over a selected time period
Orders – the number of purchases made
Online store sessions – how much traffic your store is getting
Conversion rate – how efficiently visitors turn into customers
Beyond the homepage, Shopify Analytics dashboard provides more detailed reports across different areas of your business, including:
Sales reports (revenue, product performance, sales over time, AOV)
Customer reports ( sessions, new vs returning customers, customer cohorts, conversion value)
Marketing reports (traffic sources and basic attribution)
Behavior reports (sessions, landing pages, and user activity)
Acquisition reports (Sessions by Referrer, Location, Device)
Inventory reports (Inventory Snapshot, Bestsellers, Days of Inventory Left)
Financial reports ( taxes, payments & fees, gross sales, net sales)
Order reports (Orders over time, fulfillment and shipping status, returns and refunds)
POS reports (POS location, retail sales by staff, location)
You can also filter reports by date, product, and channel, though advanced customization depends on your Shopify plan.
For many merchants, especially in the early stages, this setup is enough to monitor day-to-day performance. It answers simple questions like “How much did I sell today?” or “How many orders did I get?”
However, while the Shopify dashboard is great for visibility, it’s primarily built for reporting what happened, not necessarily for helping you understand why it happened or what to do next.
For brands operating across multiple channels or product lines, this becomes a key limitation. Beyond surface-level metrics, you need metrics that guide decisions, like understanding how your revenue actually turns into profit.
This is exactly why many growing brands outgrow the default Shopify Analytics and explore more advanced dashboards.
Why Growing Brands Look Beyond the Shopify Analytics Dashboard
Growing brands need deeper answers every day, but they’re difficult to solve using the default Shopify Analytics alone.
For example:
Shopify shows revenue but are you actually making a profit?
Shopify shows campaign performance but are your campaigns profitable after costs?
Shopify shows best-selling products but are they your most profitable ones?
Shopify shows orders but which ones are actually profitable after discounts and returns?
Shopify shows customer data but which customers are actually worth acquiring?
Shopify shows sales by channel but which channels are delivering real ROI?
While Shopify can surface many relevant metrics, answering these questions often requires multiple clicks, exports, or manual analysis. Even then, it’s still not enough to get a complete or fully accurate view of your business.
That’s because:
1. No visibility into data outside Shopify
Scaling brands typically add more channels, tools, and workflows. Revenue data lives in Shopify, ad performance lives in Meta and Google Ads, retention metrics live in Klaviyo, and inventory data often sits elsewhere. This fragmentation slows decision-making.
According to Salesforce’s State of Marketing research, only 31% of marketers say they are fully satisfied with their ability to unify customer data sources, Source: Salesforce, 2025.
2. Revenue-focused reporting
Shopify can show top-line sales, but many brands struggle to understand:
Net profit after ad spend, fulfillment & operational costs
Real contribution margins
Product, order and channel level profitability
Ad-driven margin erosion
Advanced dashboards help Shopify brands measure true profit after accounting for ad spend, shipping costs, discounts, refunds, and operational costs.
For example, many sellers rely on dedicated shopify profit dashboard tools to identify products generating revenue but losing money after CAC and shipping costs.
3. Attribution accuracy is compromised
Customer journeys are increasingly multi-channel. Shopify’s default attribution model is largely last-click based, which creates blind spots for multi-touch customer journeys.
Moreover, Shopify itself acknowledges that analytics discrepancies can occur across platforms due to tracking limitations, privacy settings, and attribution differences.
That’s why many merchants move toward ecommerce data dashboards that reconcile multiple data sources instead of relying solely on platform-native analytics.
4. Limited flexibility to customize dashboards around your specific needs
While some filtering and report customization is available depending on your Shopify plan, many merchants still struggle to build dashboards around the exact KPIs their teams use to make decisions.
In other words, while Shopify gives you data from multiple angles, it doesn’t bring everything together into a single, decision-ready view.
That’s why many growing brands start looking for a better Shopify dashboard app or more advanced reporting setup that surfaces the right metrics, in one place, without the extra friction.
Based on what many merchants wish they had, we built Bloom, a dashboard that brings all relevant metrics into one actionable view, so you can quickly understand performance, spot issues, and make decisions without digging through multiple reports.
Let’s take a closer look at what a better ecommerce profitability dashboard tool should include.
Best ecommerce Profitability Dashboard Tool for Shopify
Bloom is built around the idea that merchants shouldn’t have to piece together insights from multiple reports just to understand how their business is performing.
Instead of separating revenue, marketing, customer, and product data across multiple reports like the default Shopify Analytics dashboard, Bloom brings the most important metrics into one clear, actionable view built around the questions growing brands actually ask every day.
For example, sellers can use Bloom to monitor:
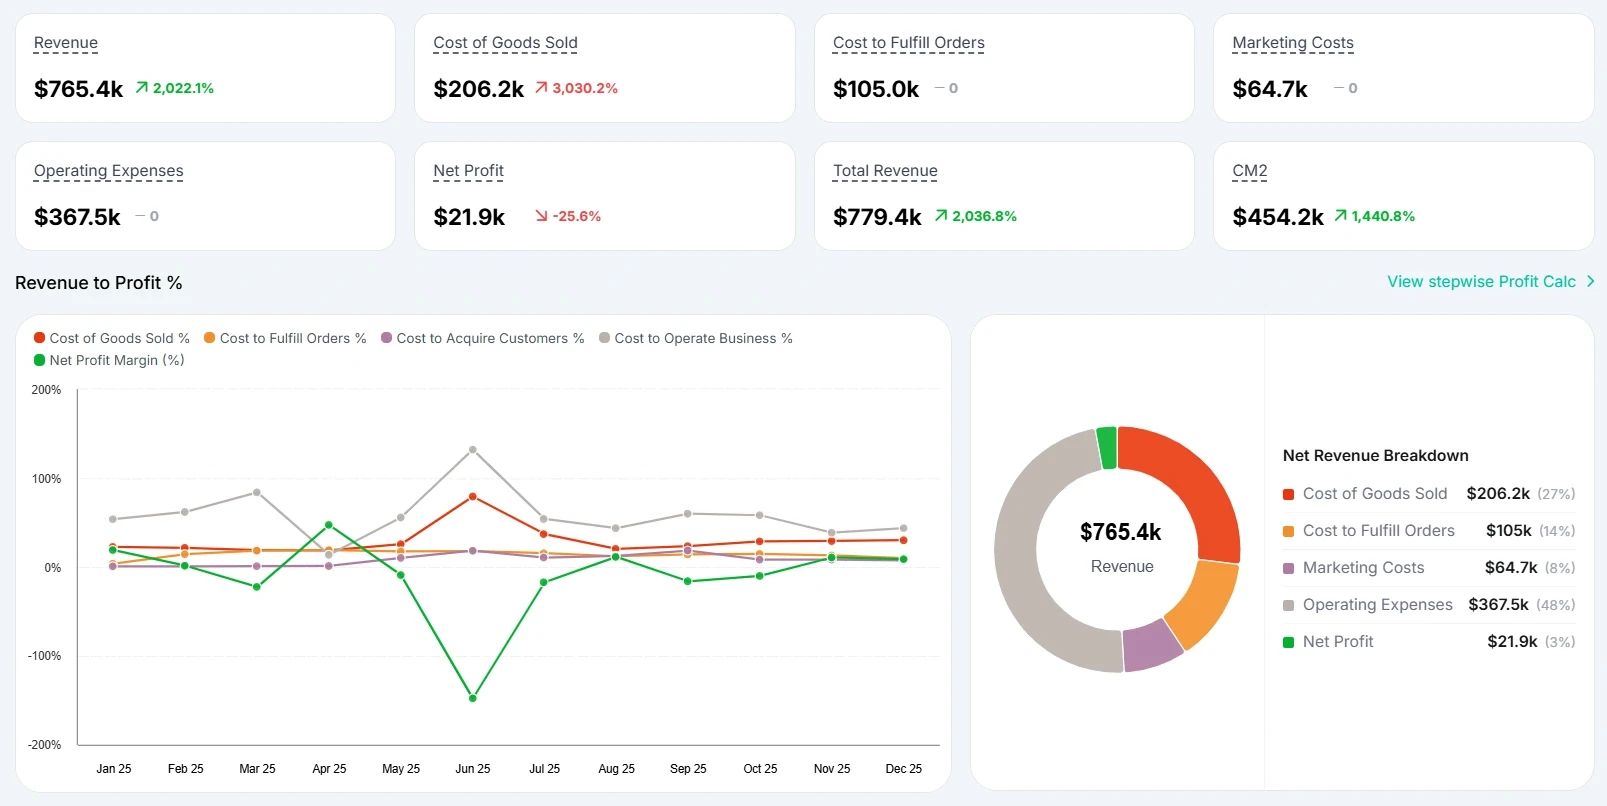
Revenue-to-profit metrics showing how revenue turns into actual profit after COGS, fulfillment costs, marketing spend, and operating expenses. It helps merchants immediately see how much of the margin is taken up by expenses, what they keep in real money after all costs and whether growth is actually profitable.
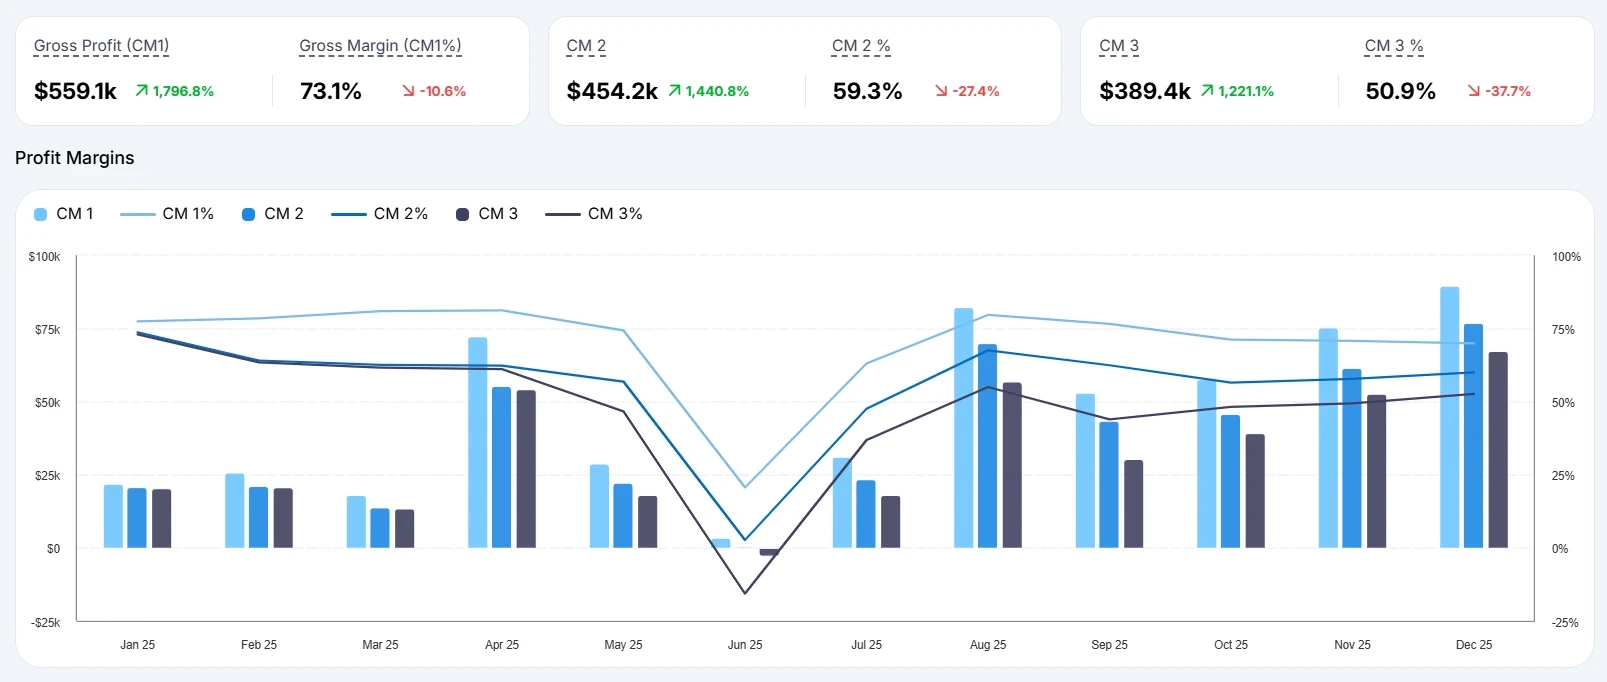
Margin breakdowns (CM1- gross profit, CM2 - margin after fulfillment, and CM3- margin after marketing) help identify which costs are impacting margins the most.
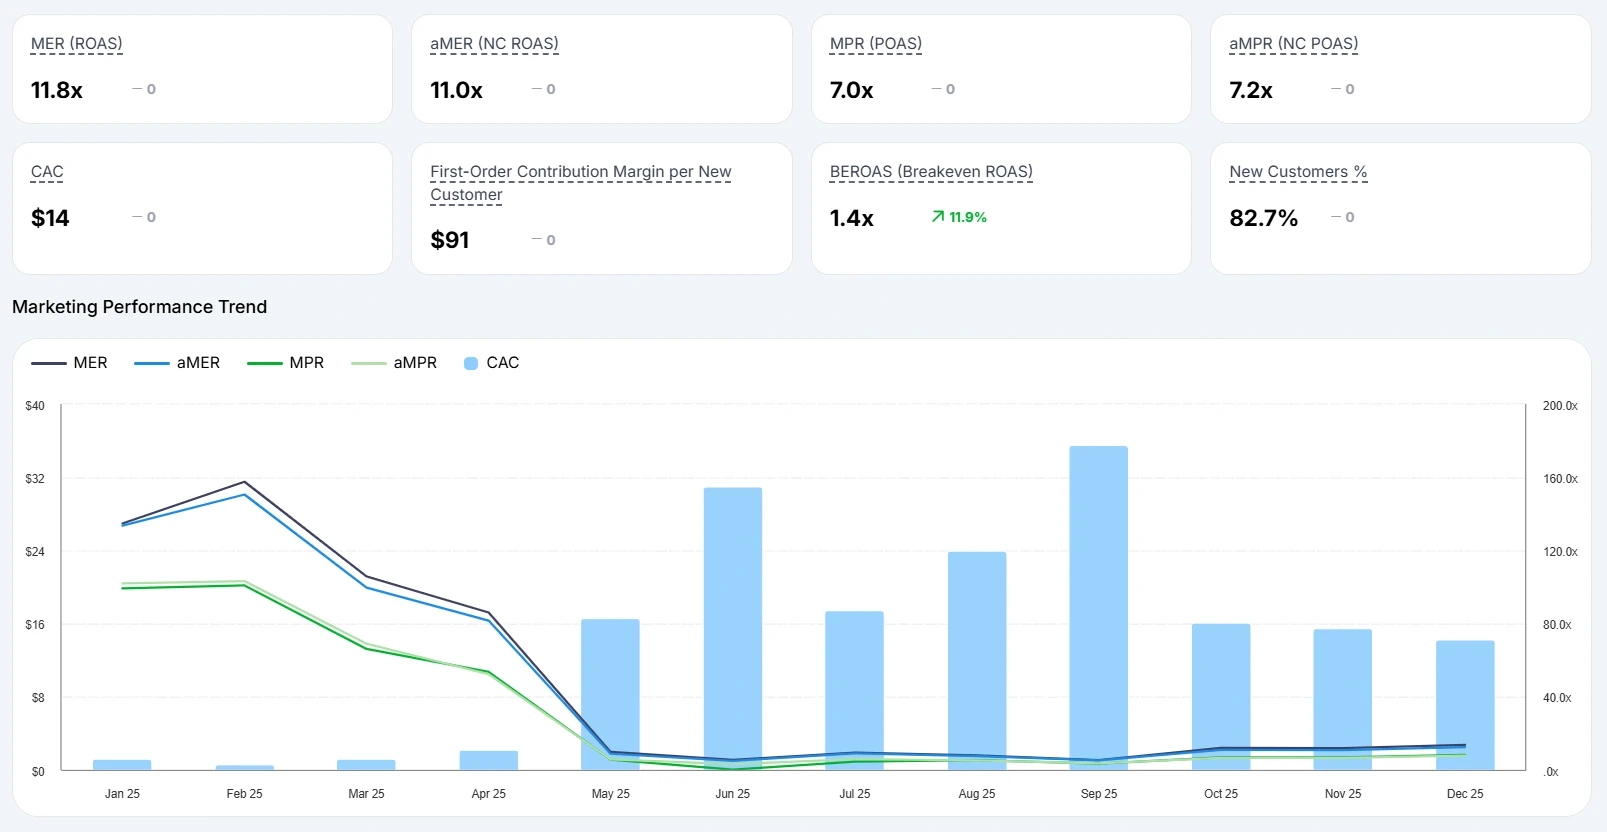
Marketing efficiency metrics like MER (ROAS), aMER (NC ROAS), MPR (POAS), and aMPR (NC POAS) to evaluate whether campaigns are driving profitable growth. These metrics help merchants measure customer acquisition efficiency, overall return on marketing spend, and actual profit generated from advertising, making it easier to decide which campaigns should be scaled, optimized, or paused.
Marketing performance trend visualizations helps merchants quickly identify performance shifts, improving or declining channel efficiency, and overall marketing momentum across different periods.
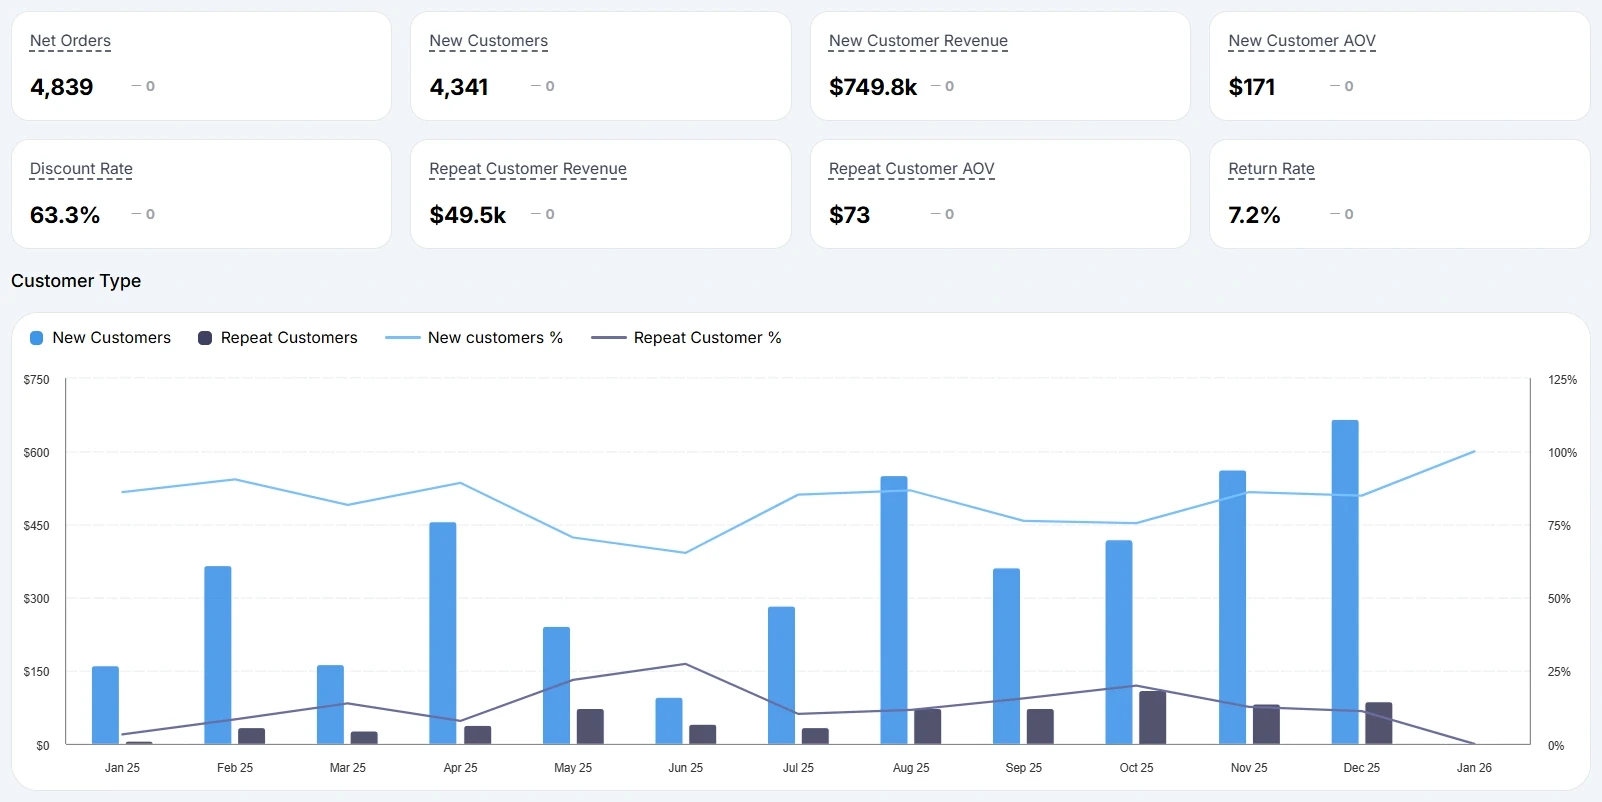
Customer and revenue metrics like new customer revenue, repeat customer revenue, AOV, return rate, and discount rate to better understand customer quality and retention
Customer trend visualizations comparing new vs returning customers over time
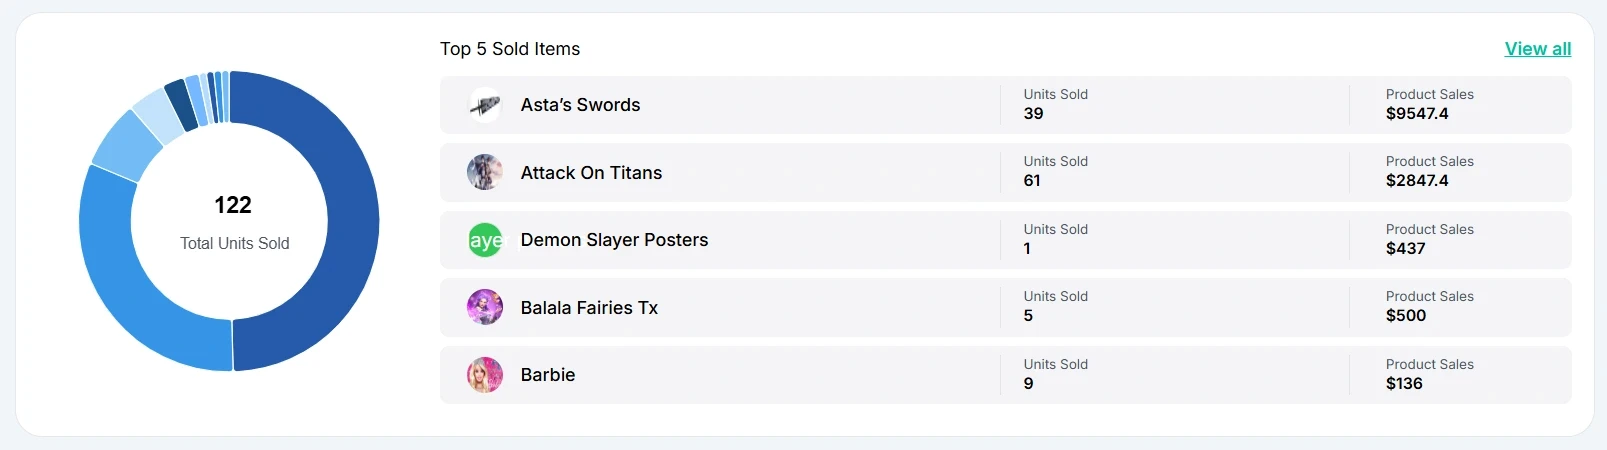
Product performance metrics highlighting top-selling products and total units sold which helps merchants identify which products are actually contributing to profitability and overall business growth.
The difference is that these insights aren’t limited to what happens inside Shopify. Bloom pulls data from Shopify, ad platforms, and other third-party tools into one unified dashboard, helping merchants see a more complete and accurate view of business performance.
And when deeper analysis is needed, each section can still be expanded into more detailed reports, making the data easier to trust, understand, and act on.
Conclusion
The Shopify Dashboard gives merchants a useful starting point for monitoring store performance, but as brands grow, reporting needs become far more complex.
Revenue alone rarely tells the full story. Growing ecommerce brands need better visibility into profitability, attribution, customer retention, and operational performance to make confident decisions.
By bringing together these insights into one place, ecommerce dashboards can transform analytics from passive reporting into a real growth advantage.
If there’s a metric or insight you wish your dashboard showed more clearly, we’d love to hear about it.
FAQs
What is the difference between the Shopify Dashboard and Shopify Analytics?
The Shopify Dashboard is the homepage summary that shows high-level metrics like sales, orders and traffic. The Shopify Analytics Dashboard includes deeper reports for sales, customers, marketing, inventory, and finance.
What is the best ecommerce profitability dashboard tool for Shopify?
The best tool depends on your goals:
Bloom Analytics - Best for profit and attribution focused decision-making
Triple Whale - Best for attribution and ad performance
Lifetimely - Best for cohort and LTV analysis
Polar Analytics - Best for first-party attribution and a dedicated data warehouse.
Can Shopify show true profit?
Shopify provides financial reports such as gross and net sales, taxes, and payment fees, but it does not natively calculate full profitability after advertising costs, shipping expenses, and operating overhead. Advanced dashboards are designed to fill this gap.
What are the limitations of Shopify’s native reporting?
Shopify’s native reporting is excellent for store-level visibility, but advanced users may still need:
Profitability after all costs
Multi-touch attribution
Unified cross-channel dashboards
Forecasting and scenario modeling
Automated reporting
What should I look for in a Shopify dashboard app?
Key criteria include:
Revenue to Profit Visibility
Contribution Margin Breakdowns
Marketing Efficiency Metrics
Channel-Level Profitability
Customer Retention Metrics
Product/Order Profitability, Not Just Sales Volume
Dashboard customization
Ease of use
Pricing and scalability
Know Your Real Profit And
The Ads That Actually Sell.
No need to spend. Just try it on your store.


