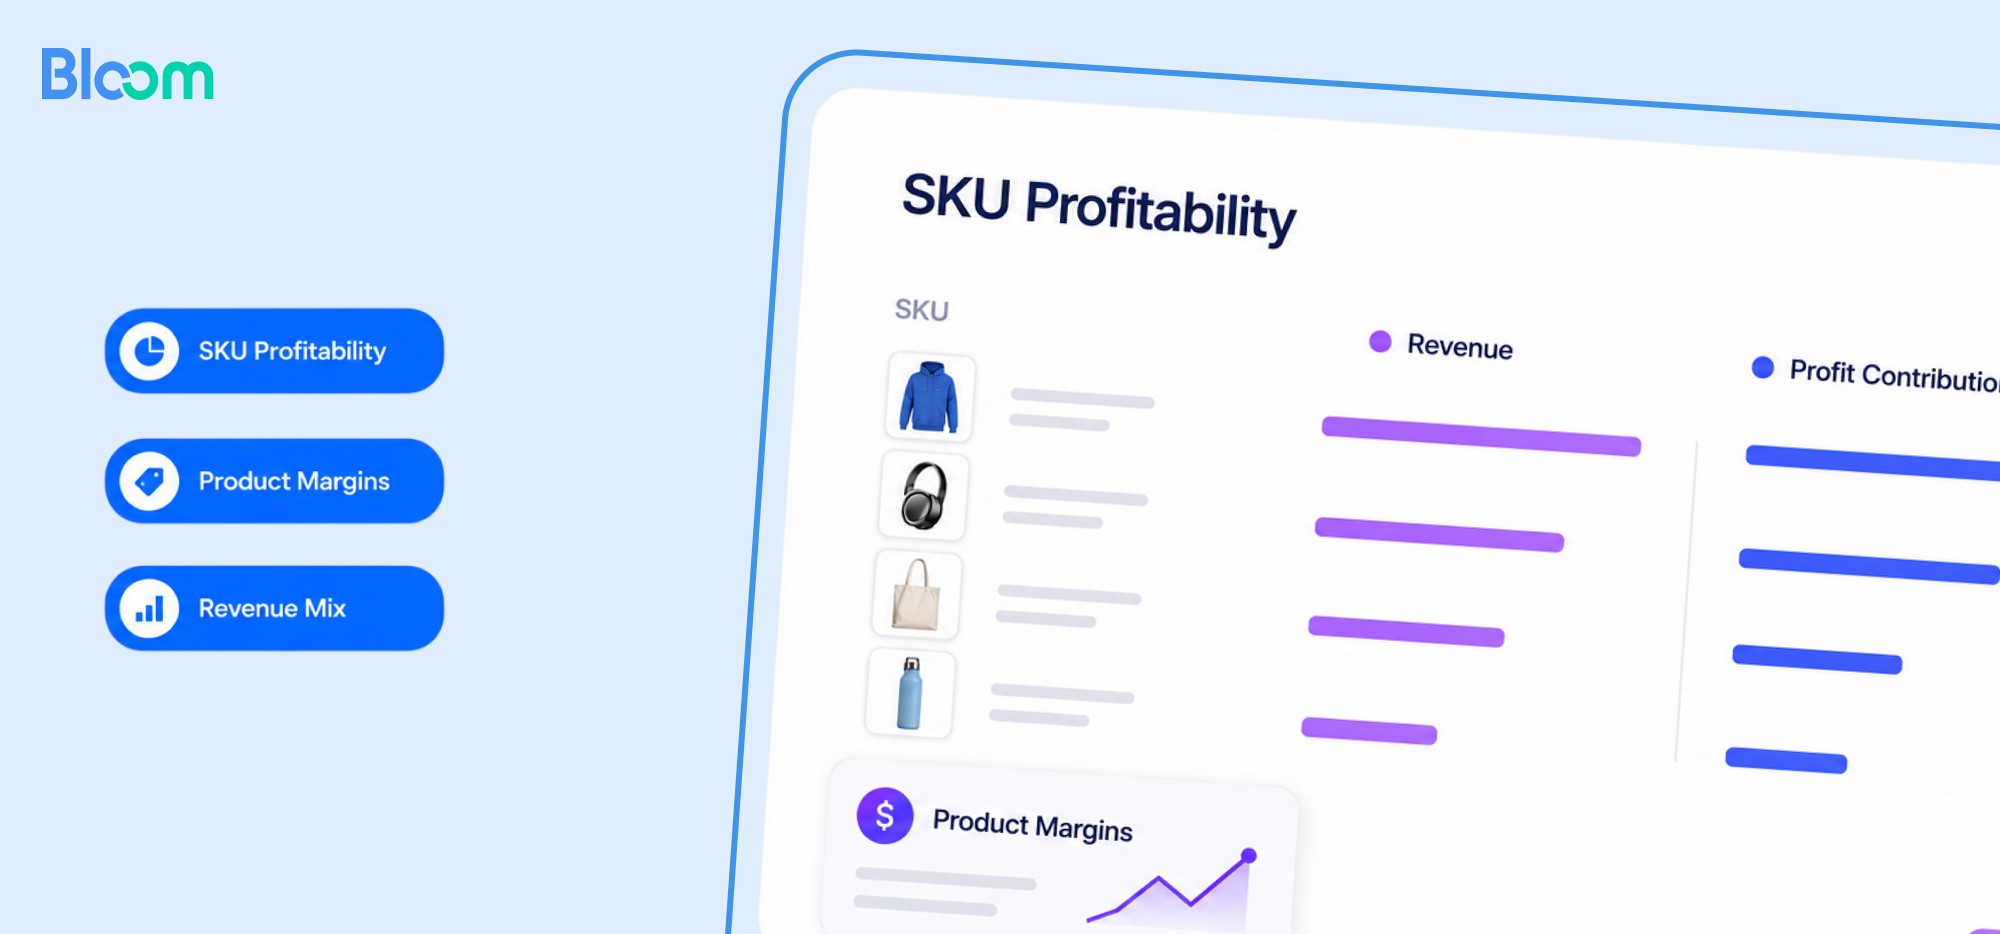


Shopify Product Analytics tracks how each SKU in your catalog performs on sales, units sold, product cost, and gross profit. It answers "what sold?" well. It doesn't answer "what made money?" once you factor in ad spend, fulfillment, returns, discounts, and processing fees.
That gap is why merchants keep restocking bestsellers that quietly lose margin and overlook mid-tier SKUs that carry the business. Revenue rank and profit rank almost never match.
This guide covers what Shopify Product Analytics measures, where its native reports fall short, and how to run a true SKU-level profitability analysis, so your restock, discount, and ad-scaling decisions are based on net profit instead of gross sales.
Key Takeaways
Shopify Product Analytics shows gross profit at the product level, not net profit after ads, fulfillment, shipping, returns, and processing fees.
A bestseller by revenue is often not the most profitable SKU once all variable costs are subtracted.
Native reports use ABC analysis (A = 80% of revenue, B = 15%, C = 5%) but can't segment by product tag or consolidate across multiple stores.
True SKU profitability = revenue − product cost − discounts − returns − ad spend − fulfillment − processing fees.
Advanced Product Analytics tools like Bloom pull all cost inputs together so you can see net profit per SKU without spreadsheet work.
What is Shopify Product Analytics?
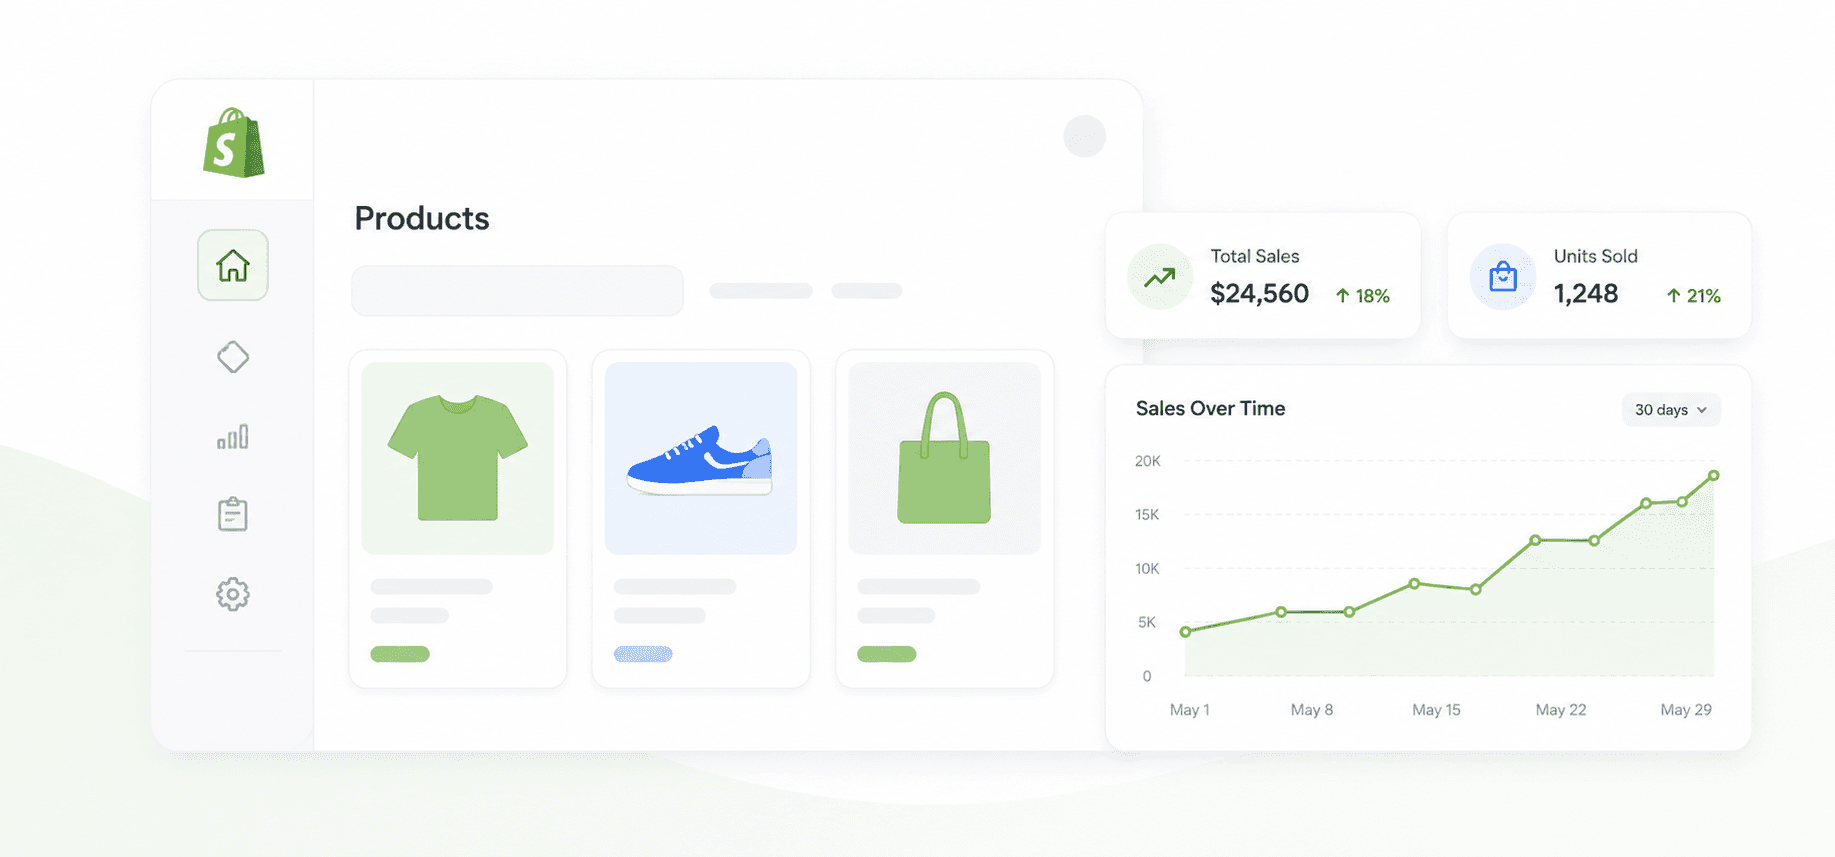
Shopify Product Analytics is the built-in reporting suite inside your Shopify admin that tracks how each product and variant performs on metrics like gross sales, net sales, units sold, product cost, and gross profit.
The reports cover:
Top Product Variant by Units Sold
Gross Profit by Product
Product Sell-Through Rate
ABC Product Analysis (categorizes SKUs by revenue contribution)
Cohort views for retention, AOV, gross sales, and customers
You can compare date ranges (last week vs. this week, month-over-month, year-over-year), set targets like "$3,500 gross sales in September" for a specific SKU, filter by currency, and toggle inventory tracking on or off.
How do you Analyze Product Performance in Shopify?
To pull a product performance report in Shopify:
Go to Analytics → Reports in your Shopify admin.
Search "Product" in the report search bar.
Open the report that matches your question (Gross Profit by Product, Sell-Through Rate, ABC Analysis, etc.).
Set your date range and, if needed, a comparison period.
Apply filters for currency, sales channel, or inventory tracking status.
Export the report or view it in the cohort chart.
For a quick health check, ABC Analysis is the fastest starting point. It sorts your catalog into three groups: A-products drive 80% of revenue, B-products drive 15%, and C-products drive the remaining 5%. That tells you where revenue concentrates. It does not tell you where profit concentrates.
Where does Shopify's Built-in Product Analytics Fall Short?
Shopify's native Product Analytics gives you gross profit, but gross profit ignores most of what actually eats your margin. Here are the specific gaps:
Gross Profit is Not Net Profit
Shopify subtracts product cost from revenue to give you gross profit. It doesn't subtract ad spend, shipping, fulfillment, payment processing (typically 2.4% to 2.9% + 30¢ per transaction on Shopify Payments), returns, packaging, or discounts applied at checkout. A SKU with 60% gross margin can easily net 5% or negative once those costs land.
You can't Filter by Product Tag
Product tags are how most merchants group SKUs (by supplier, collection, seasonality, launch cohort). Native Product Analytics doesn't let you filter reports by tag, so tag-based analysis means exporting to a spreadsheet.
No Consolidated Multi-store View
If you run a US store and a UK store, or a DTC store and a wholesale store, Shopify keeps their analytics separate. You can't see profitability of the same SKU across both storefronts in one report.
Limited Customization
The reports Shopify ships with are fixed. You can adjust date ranges and a handful of filters, but you can't build a custom SKU profitability report that pulls in ad spend from Meta or Google, or fulfillment costs from your 3PL.
No Attribution to Ad Spend
Shopify doesn't tie ad spend from your ad platforms back to specific SKUs. If a SKU is selling well because you're spending $1,500 a month promoting it on Meta, native reports won't show that. Gross profit will look strong even when true ROAS is under 1.
Why do Merchants Need Advanced Product Analytics?
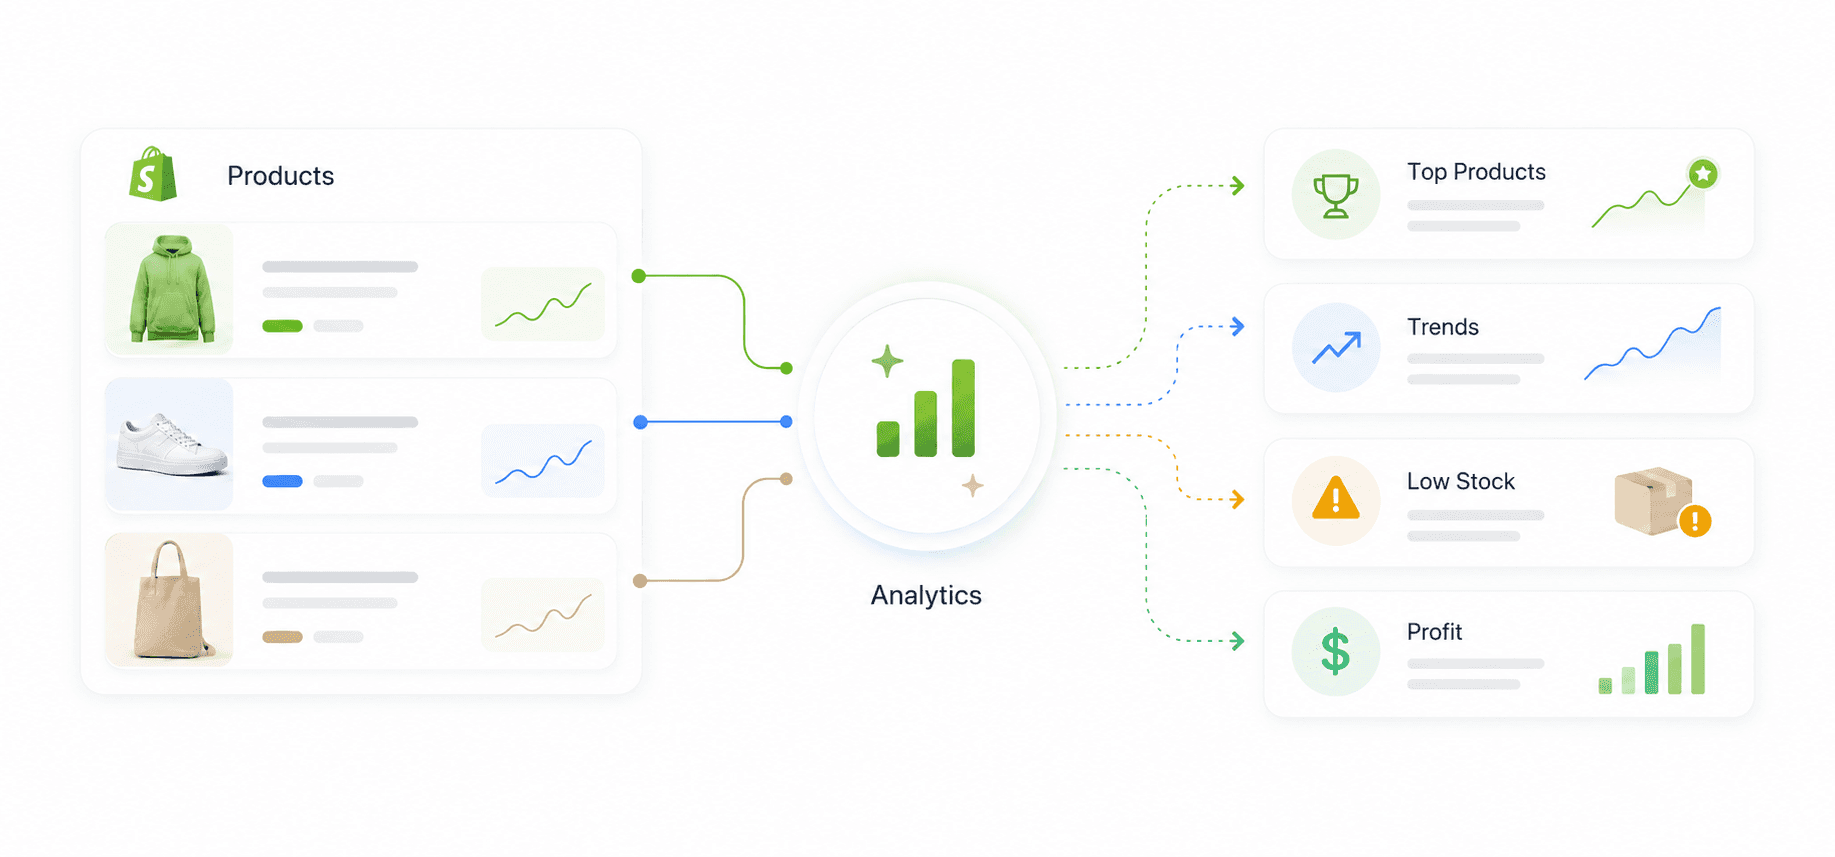
Advanced Product Analytics tools solve the gaps above by pulling cost data from every source (product cost, shipping, fulfillment, ad platforms, payment processors, operating expenses) and calculating net profit per SKU automatically. Merchants use them for five reasons:
Multi-store and large catalog reporting in one view. A 5,000-SKU catalog or a two-store setup is impossible to analyze cleanly in native Shopify reports.
Finding profitable non-bestsellers. Your #1 SKU by revenue often isn't your #1 by profit. Advanced analytics surfaces the mid-tier SKUs that punch above their weight.
Product trend analysis. See which SKUs are growing, declining, or plateauing on a rolling 30, 60, and 90-day basis.
Confident scaling decisions. Real net-profit data (not gross profit) tells you which SKUs are safe to double ad spend on.
Smarter inventory decisions. Reorder based on profit contribution, not units sold. A high-volume, low-margin SKU with heavy returns is often the wrong thing to restock.
How do you Analyze Product-level Profitability?
To calculate true SKU profitability, work through this sequence for each product (or variant if you sell multi-variant SKUs):
Start with units sold for the SKU in your date range.
Multiply by selling price to get gross revenue.
Subtract product cost (COGS) per unit.
Subtract discounts applied at checkout.
Subtract refunds and returns including any return shipping you covered.
Subtract payment processing fees (roughly 2.4% to 2.9% + $0.30 per order on Shopify Payments).
Subtract shipping and fulfillment costs including packaging.
Subtract ad spend attributed to the SKU across Meta, Google, TikTok, and any other channels.
Subtract any SKU-level operating costs like storage or per-unit handling.
What's left is your net profit per SKU. Divide by units sold for net profit per unit, or by revenue for net profit margin.
Run the same analysis across different date ranges to spot seasonality, and split online vs. retail if you sell in both channels. Then group SKUs by category, supplier, or collection using product tags to see which segments of your catalog carry the business.
This is where the money leak becomes visible. You'll typically find one of three patterns: discounts eating margin, product cost creep from a supplier price change, or ad spend outpacing the product's contribution margin.
Which Shopify Product Analytics Tool Should You Use?
Shopify's native reports work for stores under about 500 SKUs with simple cost structures and one sales channel. Past that, you'll need an app that automates the calculation.
Bloom is a Shopify-native profit analytics app built for merchants who want net SKU profitability without spreadsheet work. It pulls product costs, ad spend across every ad platform, fulfillment costs, processing fees, and operating expenses into one view, then calculates profit per SKU, per order, and per customer. Its Product Insights feature flags three categories of SKUs: proven winners, hidden opportunities with strong margin potential, and risk SKUs generating negative returns after ad spend.
For merchants running multiple stores or catalogs over 1,000 SKUs, Bloom consolidates the view so you can compare SKU profitability across storefronts in a single report.

Frequently Asked Questions
What's the difference between gross profit and net profit in Shopify?
Gross profit in Shopify is revenue minus product cost. Net profit is what's left after also subtracting ad spend, fulfillment, shipping, payment processing, discounts, and returns. Shopify's native Product Analytics shows gross profit only.
Can Shopify show me the most profitable products?
Shopify can show your top products by gross profit, but not by net profit. To rank SKUs by true profitability, you need to layer in ad spend, fulfillment, and processing fees, which requires either a spreadsheet export or a profit analytics app.
How do I export product data from Shopify Analytics?
Open any report under Analytics → Reports, apply your filters and date range, then click the export button in the top right. Reports export as CSV for further analysis in a spreadsheet or BI tool.
What is ABC analysis in Shopify?
ABC analysis is a native Shopify report that groups your products by revenue contribution: A-products generate 80% of revenue, B-products 15%, and C-products the remaining 5%. It's useful for identifying revenue concentration but doesn't reflect profitability.
Does Shopify track profit per SKU across multiple stores?
No. Shopify reports profit per SKU within a single store. To see the same SKU's profitability across a US store and a UK store, or a DTC and a wholesale store, you need a multi-store profit analytics app.
Why is my bestselling product not my most profitable?
Bestsellers usually attract heavier ad spend, deeper discounts, and higher return rates. Once those costs land, gross profit and net profit diverge. A mid-tier SKU with 45% gross margin, low returns, and organic traffic can out-earn a bestseller with 55% gross margin, heavy paid traffic, and 15% returns.
Discover More