A Shopify profit dashboard is a single view that pulls revenue, ad spend, fulfillment, fees, and operating costs together, then walks you from total revenue down to net profit. It replaces the weekly spreadsheet routine and shows what your store actually keeps, not just what came in.
If you're looking for one, you've already figured out that revenue alone doesn't help you make decisions. What you need is what's left after every cost, the real number that runs your business. A good Shopify profit dashboard gives you that number, shows where money is going, and highlights how each cost eats into your margin.
But not every dashboard gets you there. Before you commit to one, it's worth knowing what a genuinely useful Shopify profit dashboard looks like and how to make it work for your store. This guide covers how to set one up, the metrics it needs, how to turn those numbers into decisions, and why a dedicated tool makes the difference.
Key Takeaways
A Shopify profit dashboard is only as accurate as its inputs. Every source of revenue and every category of cost needs to be tracked.
Contribution margins (CM1 to net profit) show where profit disappears, so you can fix the exact stage that's leaking.
Marketing metrics like MER, MPR, and CAC tell you whether ad spend is paying back in real profit, not just revenue.
Period comparisons catch "fake growth" where revenue climbs but net profit drops.
A dedicated Shopify profit dashboard replaces the weekly juggling of Shopify, Meta, Google, and your accountant's P&L.
Setting Up Your Dashboard for Accurate Analysis
Accurate numbers start with accurate inputs. Before a Shopify profit dashboard can show real profit, every dollar you earn and every dollar you spend needs to be accounted for.
Track Your Revenue
Revenue is the starting point for every profit calculation. Make sure all your Shopify sales are recorded accurately. And if you earn money outside Shopify, from a physical store or another sales channel, that revenue needs to be tracked too. Without the full picture, the dashboard only sees part of your business, and the profit it shows won't reflect what you're actually earning across the board.
Track Your Costs and Expenses
Revenue is easy to see. Costs hide in many different places, and missing even one makes your profit look better than it really is. To get a true picture, each of these needs to be accounted for.
Product costs: Profit is only accurate when every product has its cost recorded, so none should be left blank. A single product with no cost quietly inflates your profit, and if it's a best-seller, you could be misreading your margins without knowing.
Ad spend: Ad spend is one of the biggest costs for ecommerce stores, so record it across every platform you run, including Google Ads, Amazon, TikTok, Snapchat, and Reddit Ads.
Fulfillment: Fulfilling an order covers picking, packing, and shipping, so keeping tabs on what you paid for fulfillment matters on every sale.
Email marketing tools: Every email campaign runs on a paid tool. The amount can be small, but leaving it out undercounts what you really spend.
Gateway fees: Shopify captures gateway fees for transactions on Shopify Payments and PayPal. If you use any other gateway, make sure those fees get tracked too.
Channel fees: If you sell through marketplaces like eBay and Amazon, they charge their own fees on the orders they bring in.
Operating expenses: Professional services, storage, employee costs, and maintenance don't show up in a sales report, but they quietly drain real profit.
Once revenue and costs are tracked, the dashboard does the math and shows what you actually keep, not just what came in. From there, focus on the metrics that drive decisions.
Metrics You Can't Compromise in a Profit Dashboard
A profit dashboard can track dozens of figures, but a small set of the right metrics is what tells you whether your store is actually healthy.
Sales and Revenue Metrics
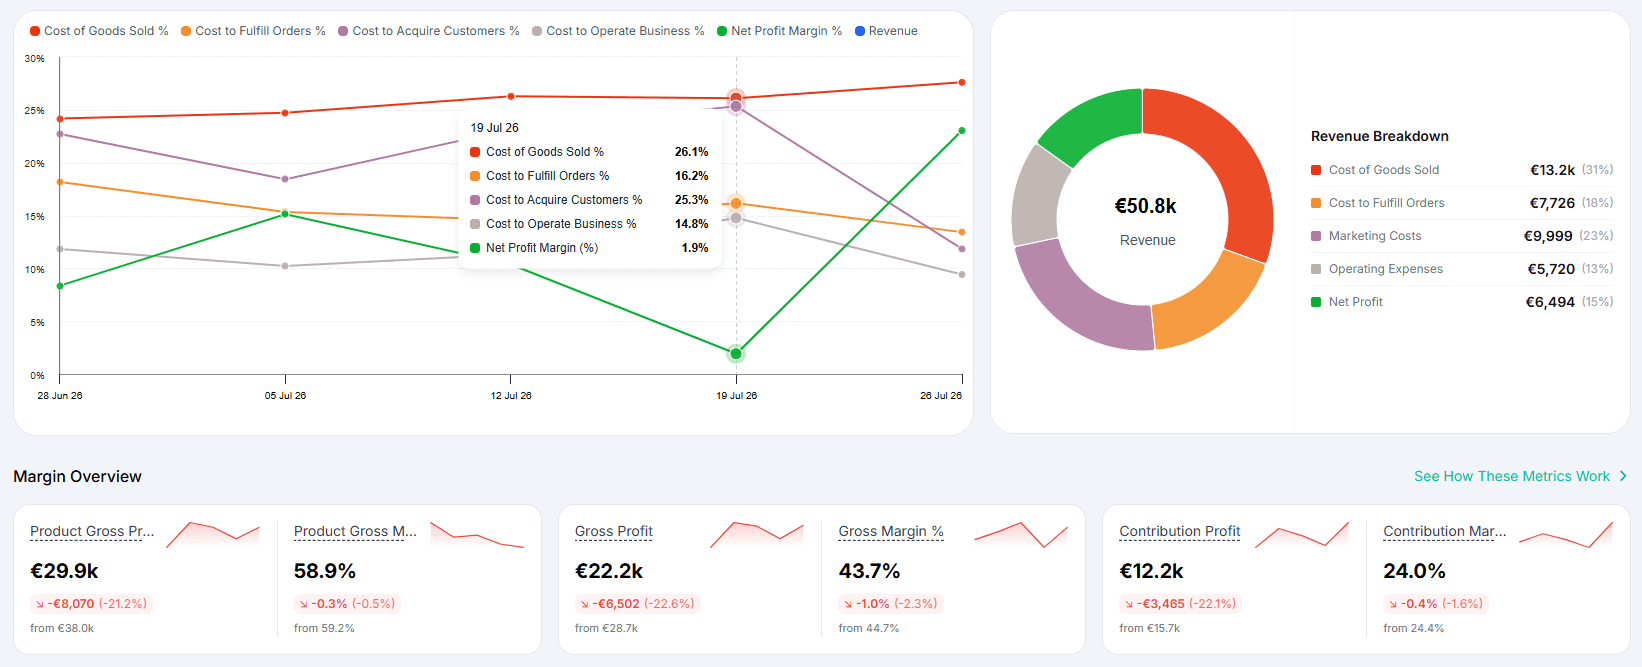
Total revenue: Everything that came in, net revenue plus taxes, duties, and tips, so you're seeing every dollar received.
Contribution margins: Instead of one flat profit figure, this breaks profit into stages: gross profit (CM1), profit after fulfillment (CM2), profit after ad spend (CM3), and net profit after operating expenses.
Customer Performance Metrics
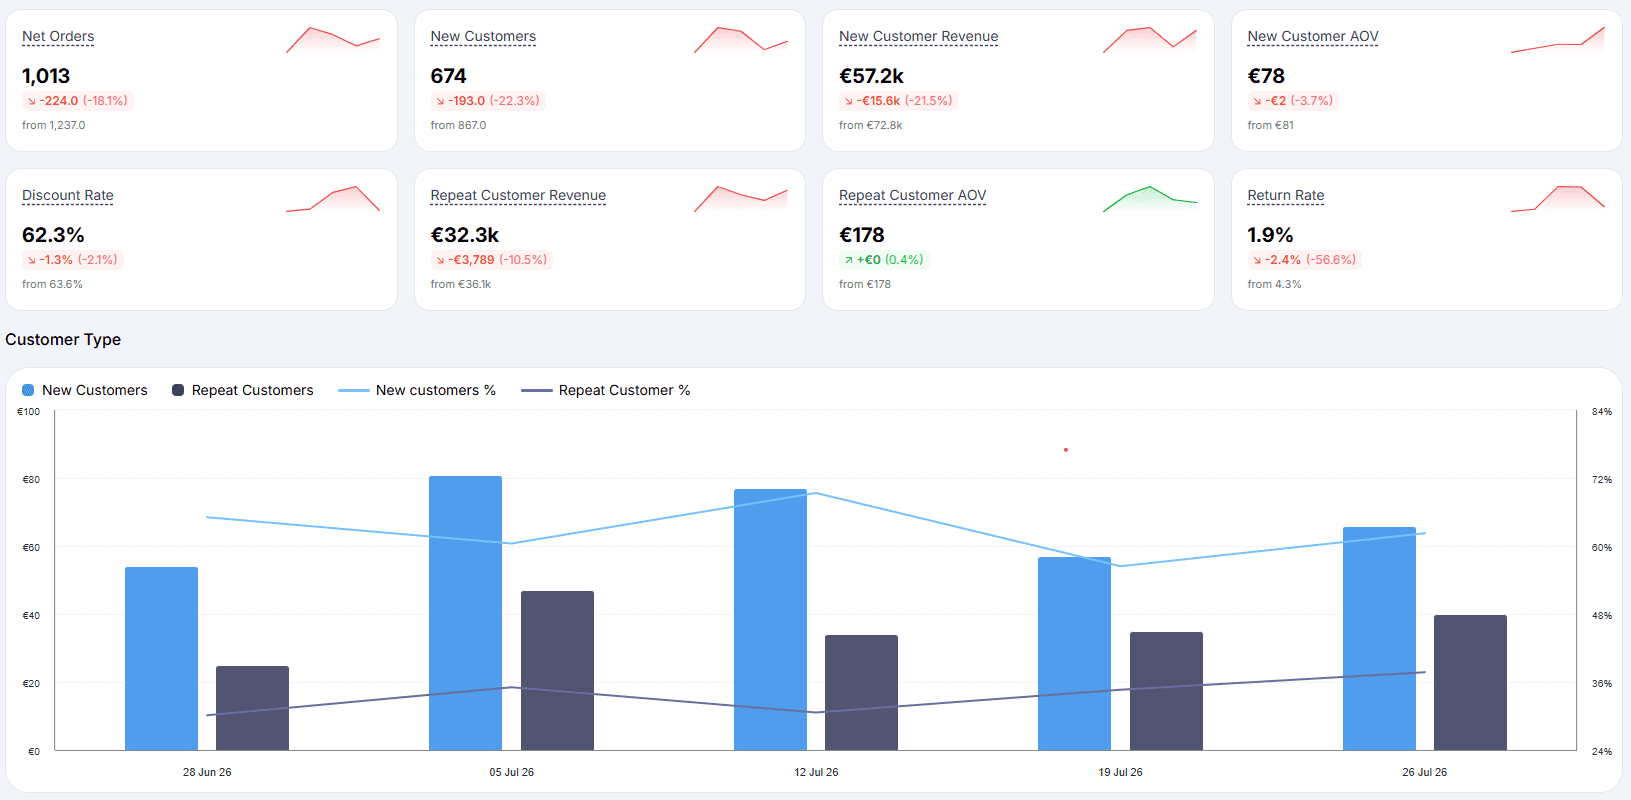
New customers: Total number of first-time buyers.
New customer revenue: Total revenue coming from first-time buyers.
Repeat customer AOV: How much your returning customers spend per order on average.
Marketing Performance Metrics
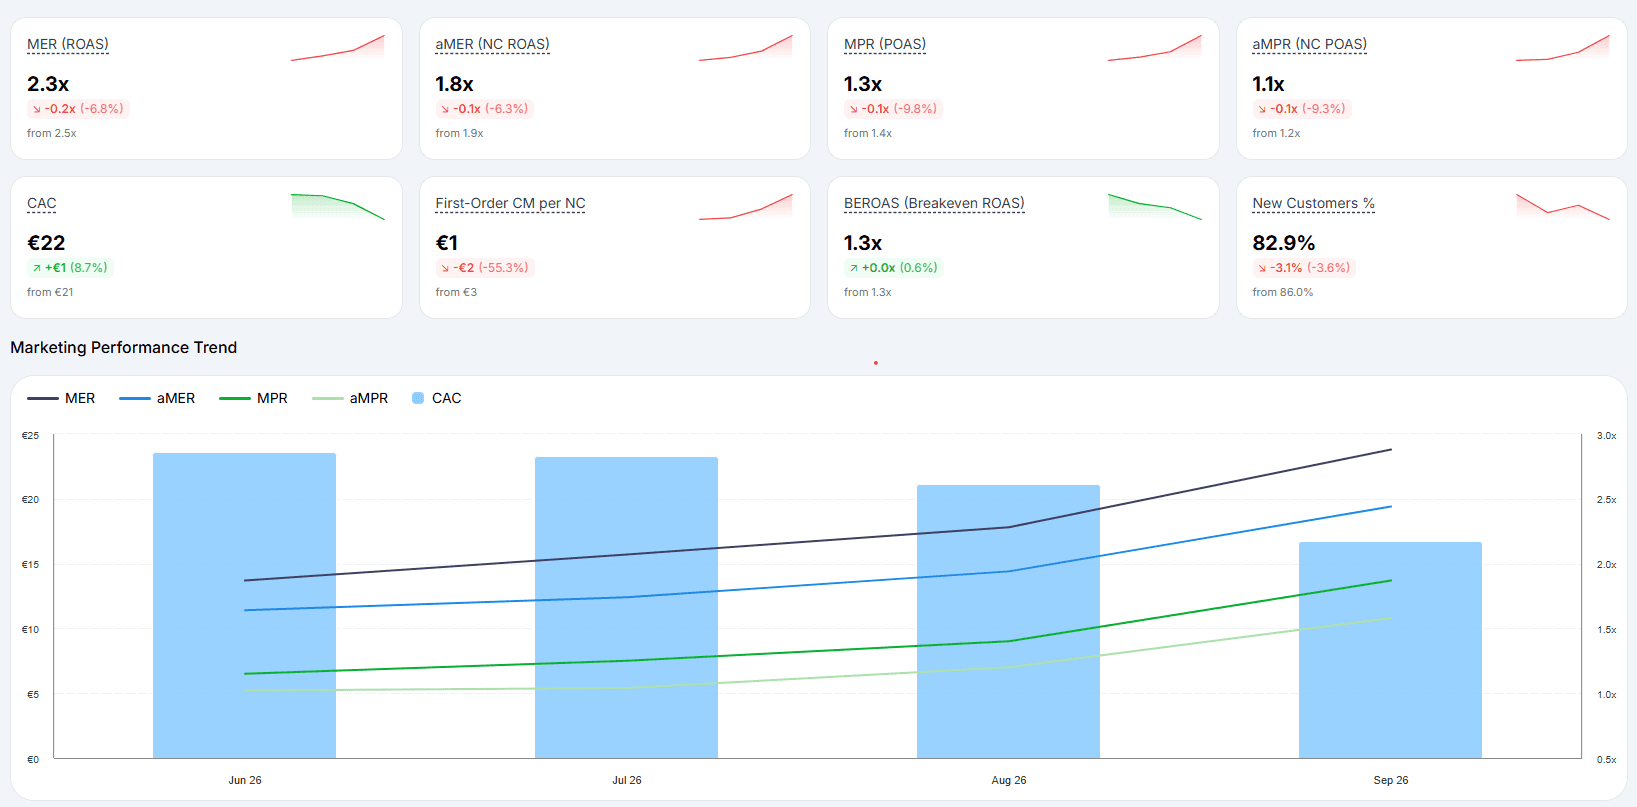
MER (Marketing Efficiency Ratio): A quick read on how well marketing turns into revenue overall. How much money comes back for every dollar spent on marketing combined.
MPR (Marketing Profit Ratio): Goes a step further than MER by showing the actual profit earned for every dollar spent on marketing.
CAC (Customer Acquisition Cost): The average cost to win a new customer. It tells you what growth is really costing you.
Product Performance Metrics
Your best sellers, shown by units moved and revenue earned. You can see the difference between what sells a lot and what actually earns the most, which are often two different products.

How to Use Data As an Action Item for Profit Growth
The dashboard is a starting point. The value comes from acting on what it shows.
Track and Plug Your Margin Leaks First
Contribution margins let you pinpoint exactly where your margin drops off between making a sale and keeping the profit. Think of it as watching your profit in stages, starting with the full sale price and then subtracting one type of cost at a time. Once you can see which stage the money disappears at, you know exactly what to fix.
If the big drop happens between gross profit (CM1) and profit after fulfillment (CM2), shipping costs are the problem. Handle that by raising your free shipping threshold, switching to a cheaper carrier, or adding a small flat shipping fee on lower-priced products.
If profit mostly vanishes at CM3, operating expenses are the problem. Go through everything you're paying for regularly and cancel whatever you're not really using.
Fix Marketing Inefficiencies
Compare your ROAS against your BEROAS (breakeven ROAS). If MER is barely above breakeven, ads are paying for themselves but not leaving you any real profit.
Then look one level deeper at MPR, which shows actual profit per ad dollar. If MPR is low or negative on a channel, it's selling products that barely profit, so the ad looks successful while quietly draining the business. When you spot those, stop spending on them and move that budget to channels with a strong MPR, the ones actually selling your profitable products.
Control Customer Acquisition Costs
Watch how CAC and aMER (new customer ROAS) move together. When CAC is going up but aMER is going down, each new customer is costing you more while bringing in less. You're paying too much to win buyers who aren't profitable.
Shift focus to keeping the customers you already have. Getting an existing customer to buy again costs far less than finding a new one, so more repeat purchases means more profit without paying that acquisition cost all over again.
Spot Fake Growth With Period Comparisons
Run a year-over-year comparison, this year against the same stretch last year. If revenue is up 20% but net profit dropped 5%, that's a red flag. You're growing bigger but taking home less, so growth is costing you more than it's bringing back.
When you see that, stop pouring in money and focus on fixing leaks. Revisit pricing, push suppliers for better rates, and cut wasted ad spend, until profit is healthy again before you scale further.
Why do You Need a Dedicated Profit Dashboard Tool
Most Shopify owners check revenue in Shopify, switch to Meta or Google to see ad spend, then wait weeks for their accountant to send a P&L. By the time it arrives, the money you lost is already gone.
Here are four reasons every Shopify merchant needs a dedicated profit dashboard.
It Brings All Your Numbers Together
Right now, your sales sit in Shopify, ad spend in Meta and Google, fees with your payment provider, and shipping costs somewhere else again. Shopify can't see any of it. A profit dashboard pulls everything into one screen, so you're not stitching spreadsheets together every week.
It Shows the Real Return on Your Ads
Your ad manager will happily show a high ROAS, but that number often hides losses. A good tool shows your BEROAS, the point where an ad just pays for itself, and your MPR, the real profit each ad dollar makes after product, shipping, and payment costs.
It Gives You Real-Time Data
A profit dashboard tracks your profit live. You watch contribution margins day by day. If a shipping fee suddenly spikes or a discount code is quietly losing you money, you catch it while there's still time to fix it.
It Fits Your Store
Every store is different. One owner cares about ad performance by channel, another wants a daily net profit view, another tracks margin by product line. A profit tool lets you build a dashboard around the numbers you actually make decisions on, instead of forcing you into a template.
Wrapping Up
Collecting data from multiple sources, cleaning out the junk, organizing it correctly, checking it for accuracy, and turning it into clear metrics on one dashboard is a lot of work. But it's the only way to see whether you're making money and where it's leaking.
Bloom does all of that for you by working as an aggregator and profit health monitor. It pulls data from your store, ad accounts, payment provider, and shipping tools, cleans it up, and turns it into a clear Shopify profit dashboard. You can also build a custom dashboard for the metrics you care about most. No spreadsheets, no waiting on your accountant, no guessing which ads are paying off. Just open the dashboard and know the profit status of your store instantly.
Frequently Asked Questions
Does Shopify have a built-in profit dashboard?
Shopify shows revenue, orders, and some cost fields, but it doesn't pull in ad spend from Meta, Google, or TikTok, and it doesn't calculate contribution margins or net profit. For a true profit view, most merchants use a dedicated Shopify profit dashboard app.
What metrics should a Shopify profit dashboard track?
At minimum, it should track total revenue, contribution margins (CM1 through net profit), MER, MPR, CAC, new customer revenue, repeat customer AOV, and best-selling products by both units and revenue.
How is contribution margin different from gross profit?
Gross profit is revenue minus product cost. Contribution margin goes further by subtracting the variable costs tied to each sale, such as fulfillment, ad spend, and payment fees, in stages. It shows exactly which cost layer is eating your profit.
How often should I check my Shopify profit dashboard?
Daily for high-volume stores, weekly for smaller ones. A live dashboard lets you catch a shipping spike or a runaway discount code before it does real damage, which a monthly P&L can't.
What's the difference between MER and MPR?
MER (Marketing Efficiency Ratio) is revenue divided by total marketing spend, so it shows revenue return. MPR (Marketing Profit Ratio) shows the actual profit each marketing dollar generates after product, shipping, and payment costs. MPR is the truer signal.
Discover More