Polar Analytics is a Shopify-native ecommerce BI platform that consolidates data from multiple sources on a dedicated Snowflake database, starting at $750/month on the Shopify App Store. Bloom is a Shopify-native profit analytics app that focuses on true net profit, contribution margin tiers, and first-party attribution, with plans starting at $20/month.
Both apps solve the same underlying problem: Shopify's native reports show revenue, not profit, and marketing channels each claim credit for the same sale. Which app is right for your store comes down to whether you need enterprise-grade BI with a broad attribution suite (Polar) or profit-first reporting with a P&L waterfall at a fraction of the entry price (Bloom). This guide breaks down pricing, profit tracking, attribution, cost coverage, and integrations so you can decide.
Key Takeaways
Polar Analytics Shopify pricing starts at $750/month for the Core Plan, scaled by online GMV. Bloom starts at $20/month, with $40 and $80 tiers scaled by feature access.
Polar tracks Contribution Margin 1 (CM1) after product cost. Bloom tracks CM1, CM2 (after fulfillment), and CM3 (after marketing), plus a P&L waterfall to net profit.
Polar offers 10+ attribution models on its server-side Polar Pixel. Bloom offers six first-party click-based attribution models on the Bloom Pixel, built to survive iOS and ad blocker restrictions.
Polar suits established DTC brands and agencies that need centralized BI across multiple sources with a dedicated data warehouse. Bloom suits small to scaling merchants who want P&L clarity, cost rules, product profit, and Profit on Ad Spend (POAS) without enterprise pricing.
Polar Analytics Shopify vs Bloom: Quick Comparison
Feature | ||
Starting price | $750/month | $20/month |
Pricing model | Single plan, scaled by online GMV | Tiered by feature access ($20/$40/$80) |
Shopify integration | Yes | Yes |
Data sources | Multiple connectors | Shopify + major ad and email platforms |
P&L waterfall | No dedicated view | Yes |
Contribution margins | CM1 | CM1, CM2, CM3 |
Custom cost rules | Limited | Yes, built in |
Profit on Ad Spend (POAS) | Yes | Yes |
First-party pixel | Polar Pixel | Bloom Pixel |
Attribution models | 10+ | 6 |
Multi-touch attribution | Yes | Yes |
AI insights | Yes | Yes |
MCP integration | Polar MCP | Bloom MCP |
Custom dashboards | Yes | Yes |
LTV and cohorts | Yes | Yes |
Email marketing analytics | Yes | Yes |
Slack and email alerts | Yes | Yes |
Country-level profit | No | Yes |
Unlimited users | Yes | Yes |
Dedicated Snowflake database | Yes | No |
Best suited for | Established ecommerce brands and agencies | Small to scaling DTC brands |
What is Polar Analytics Shopify?
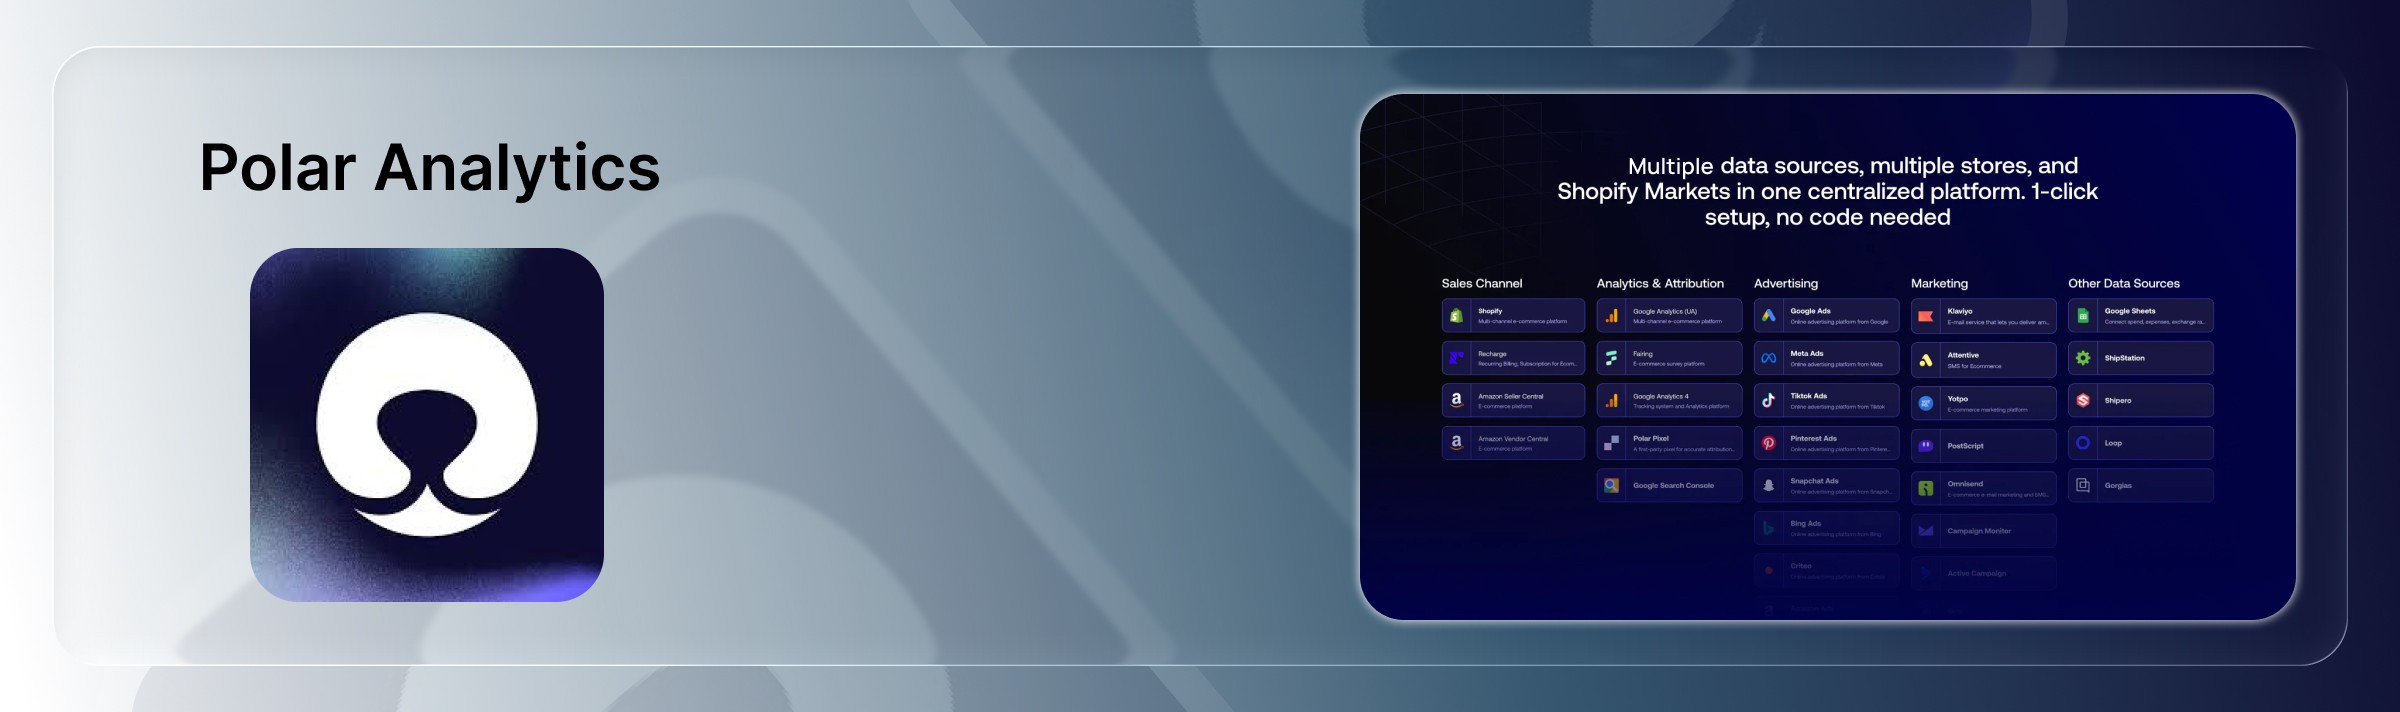
Polar Analytics is a Paris based ecommerce BI platform launched in 2020, built for DTC brands running on Shopify. It centralizes data from multiple sources including Shopify, Meta, Google, TikTok, Klaviyo, and Amazon into a single dashboard powered by a dedicated Snowflake database.
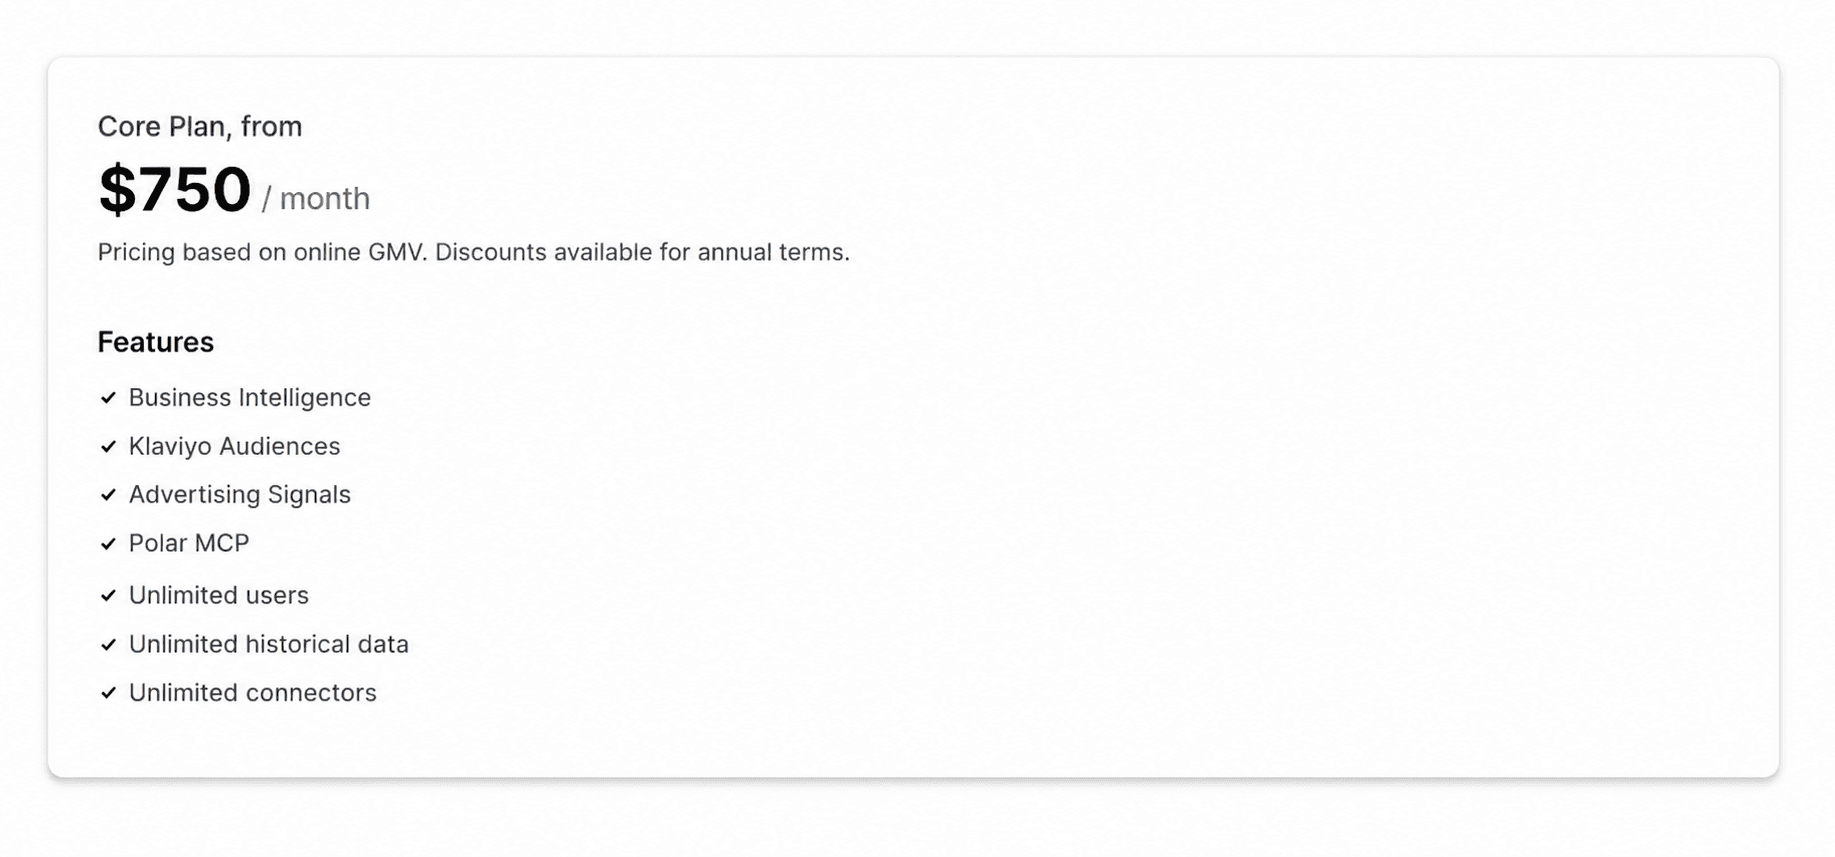
Its Core Plan bundles Business Intelligence, Klaviyo Audiences recovery, Advertising Signals, Polar MCP, unlimited users, unlimited historical data, and unlimited connectors.
What is Bloom?
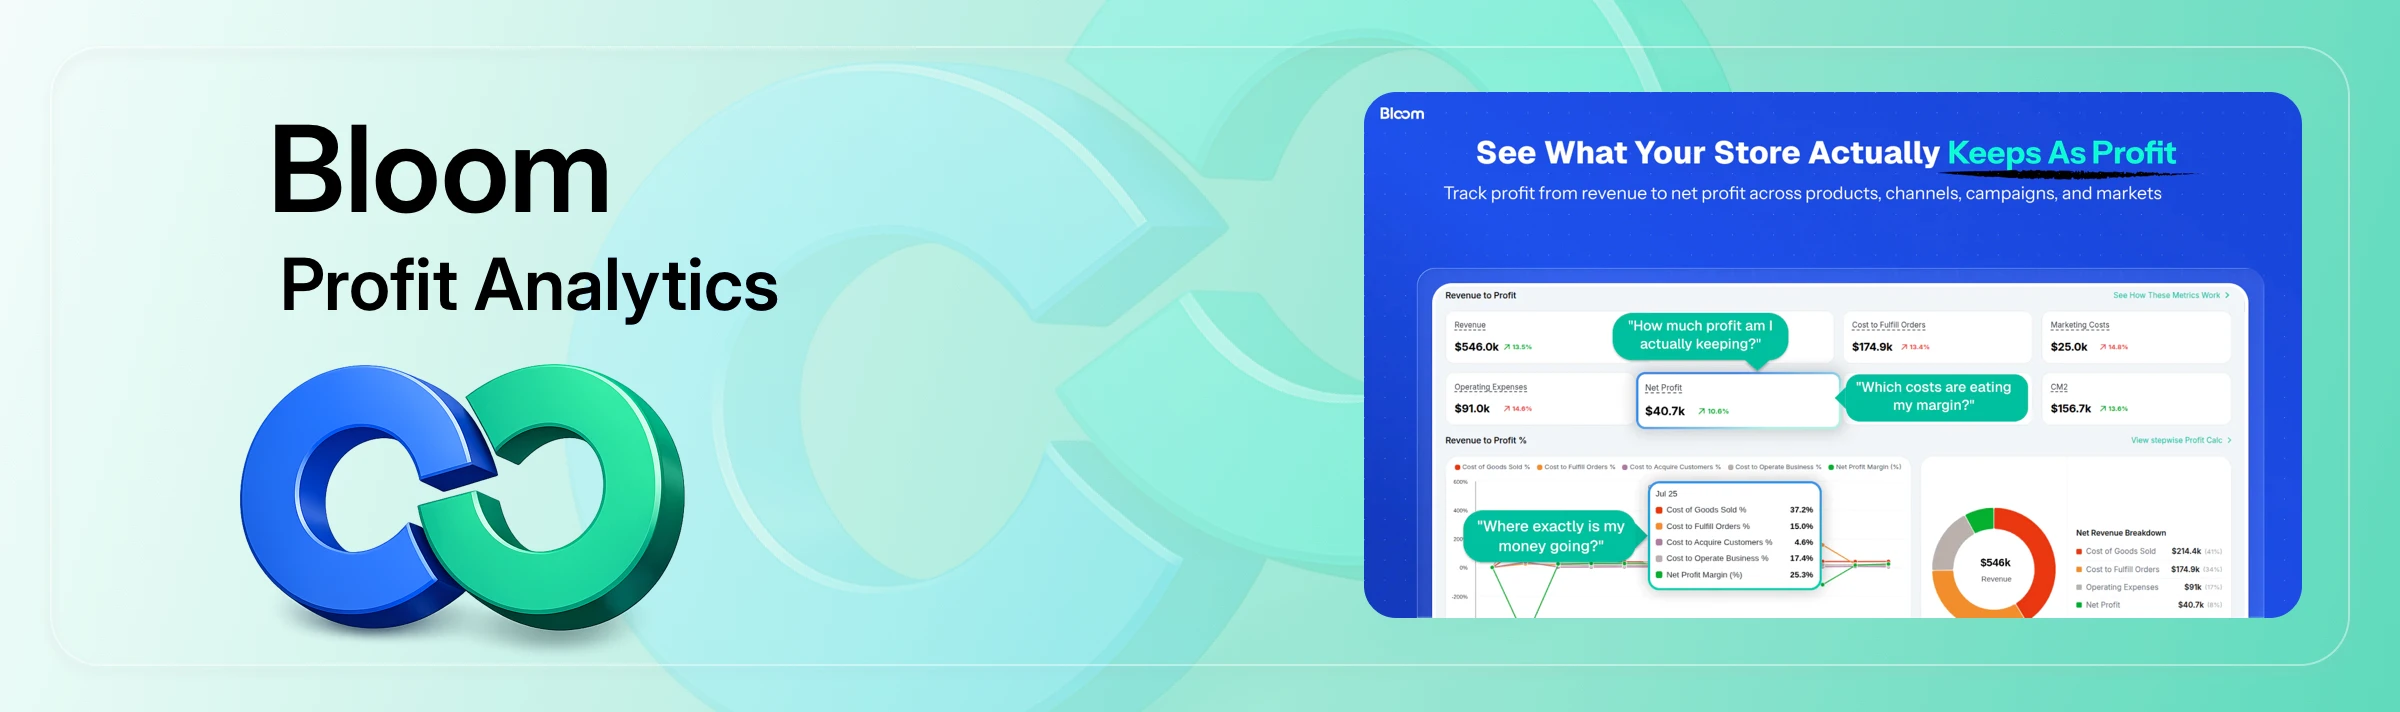
Bloom is a Shopify native profit analytics platform. It converts Shopify orders, ad spend, COGS, shipping, transaction fees, and operating expenses into a clean end to end net profit view. It supports contribution margin tiers (CM1, CM2, CM3), a P&L waterfall, product level and country level profit, POAS reporting, and first-party attribution through the Bloom Pixel.
Integrations include Meta, Google, TikTok, Snapchat, Pinterest, Klaviyo, Omnisend, Mailchimp, and major shipping platforms. Bloom also exposes an MCP endpoint that lets AI assistants like Claude and ChatGPT query commerce data directly. Alerts run through Slack and email.
Polar Analytics Pricing vs Bloom Pricing
Pricing is where the two apps sit furthest apart. They are built for different types of stores, and the pricing model reflects that.
Polar Analytics Pricing
Polar Analytics pricing starts at $750/month for the Core Plan on the Shopify App Store, with the final price scaled by online GMV. The Core Plan includes Business Intelligence, Klaviyo Audiences, Advertising Signals, Polar MCP, unlimited users, unlimited historical data, and unlimited connectors. Polar also offers separate incrementality testing packages and data activation add ons priced on top of the Core Plan.
That $750/month entry point is designed for established DTC brands with meaningful GMV and a data team or agency partner to make use of a full BI stack. It is not a small-store price.
Bloom Pricing
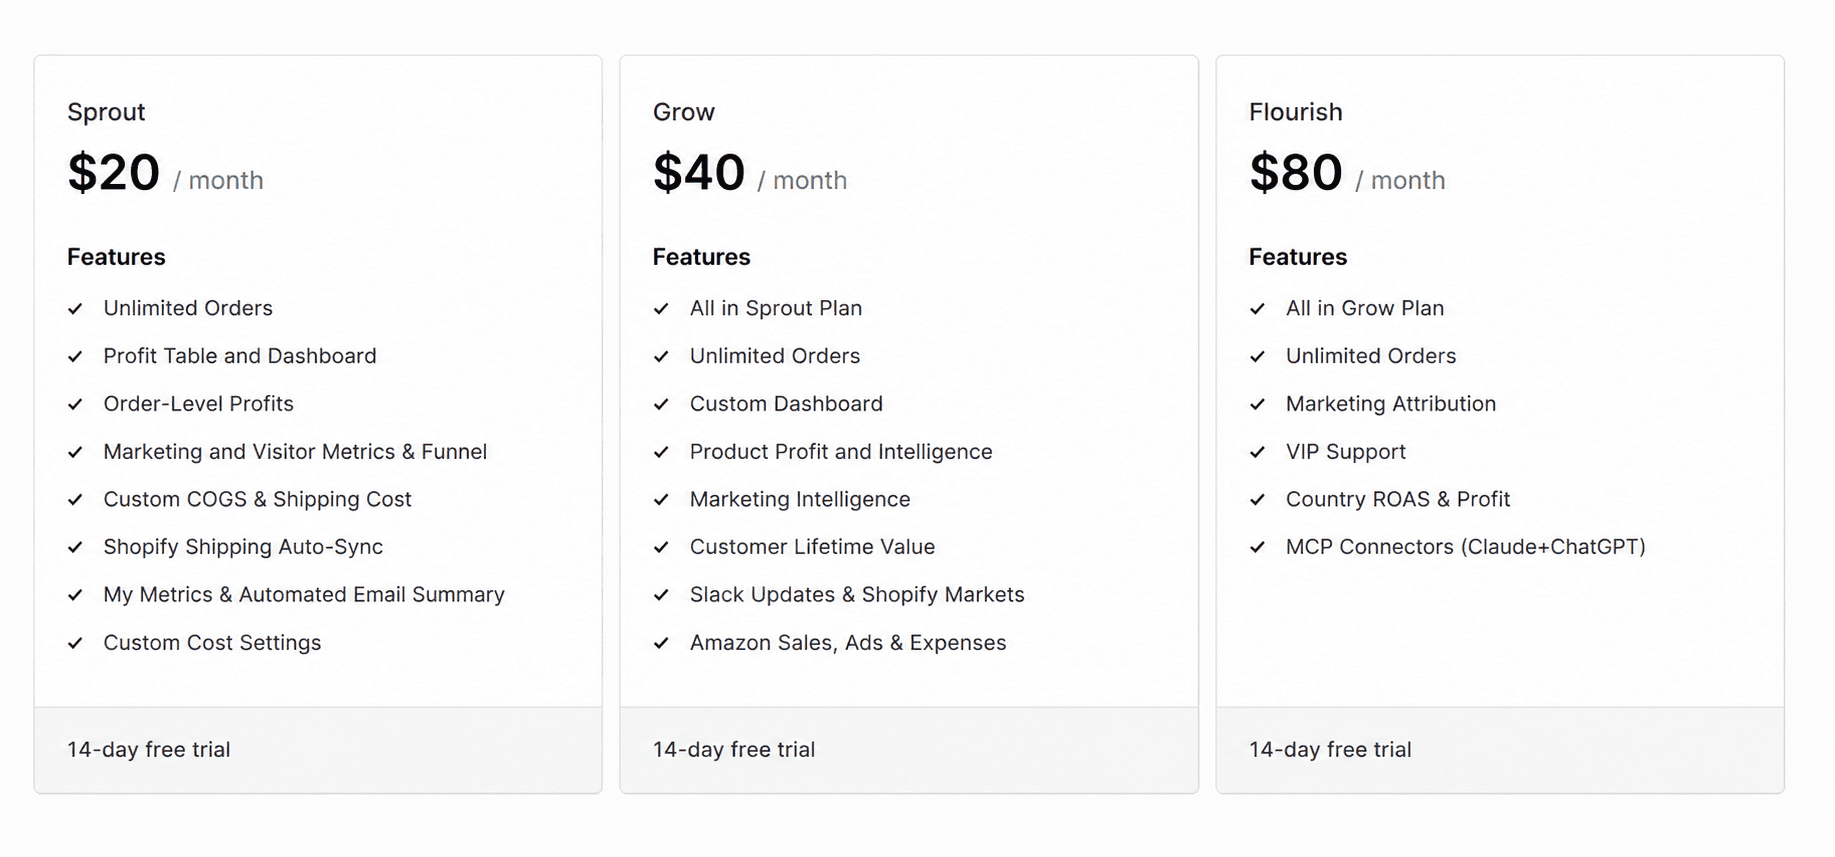
Bloom uses a tiered model priced by feature access rather than order volume:
$20/month: core profit reporting, product profit, campaign attribution, custom expenses, and Bloom Pixel.
$40/month: adds deeper marketing analytics, LTV, cohort reporting, and additional integrations.
$80/month: unlocks the full feature set including advanced attribution, POAS reporting, and multi-store roll ups.
Every plan includes a 14-day free trial. There is no forced upgrade based purely on order count.
Pricing Side by Side
Attribute | ||
Pricing model | Single monthly plan | Tiered monthly plans |
Starting price | $750/month | $20/month |
Scaling factor | Online GMV | Feature access |
Plan options | Core Plan (plus custom add ons) | 3 plans |
Free trial | Available on request | 14 days on every plan |
Best suited for | Established and enterprise brands | Small, growing, and scaling brands |
Bottom line: the two apps do not compete on price in any meaningful way. Polar Analytics starts roughly 37x higher than Bloom's entry tier. If budget is a material constraint, that difference alone often decides the choice.
Profit Tracking: Contribution Margin vs Full P&L
Both apps go beyond revenue to measure profitability, but they treat the P&L at different levels of depth.
How Polar Analytics Tracks Profit
Polar tracks Contribution Margin 1 (CM1), which is revenue after product costs. That gives brands a view of profit at the product level after COGS, discounts, and returns. Additional operating expenses can be imported through Google Sheets to build out a fuller P&L, though this sits outside the core reporting flow.
How Bloom Tracks Profit
Bloom reports the full contribution margin stack:
CM1: profit after product costs.
CM2: profit after product cost and order fulfillment cost.
CM3: profit after marketing spend.
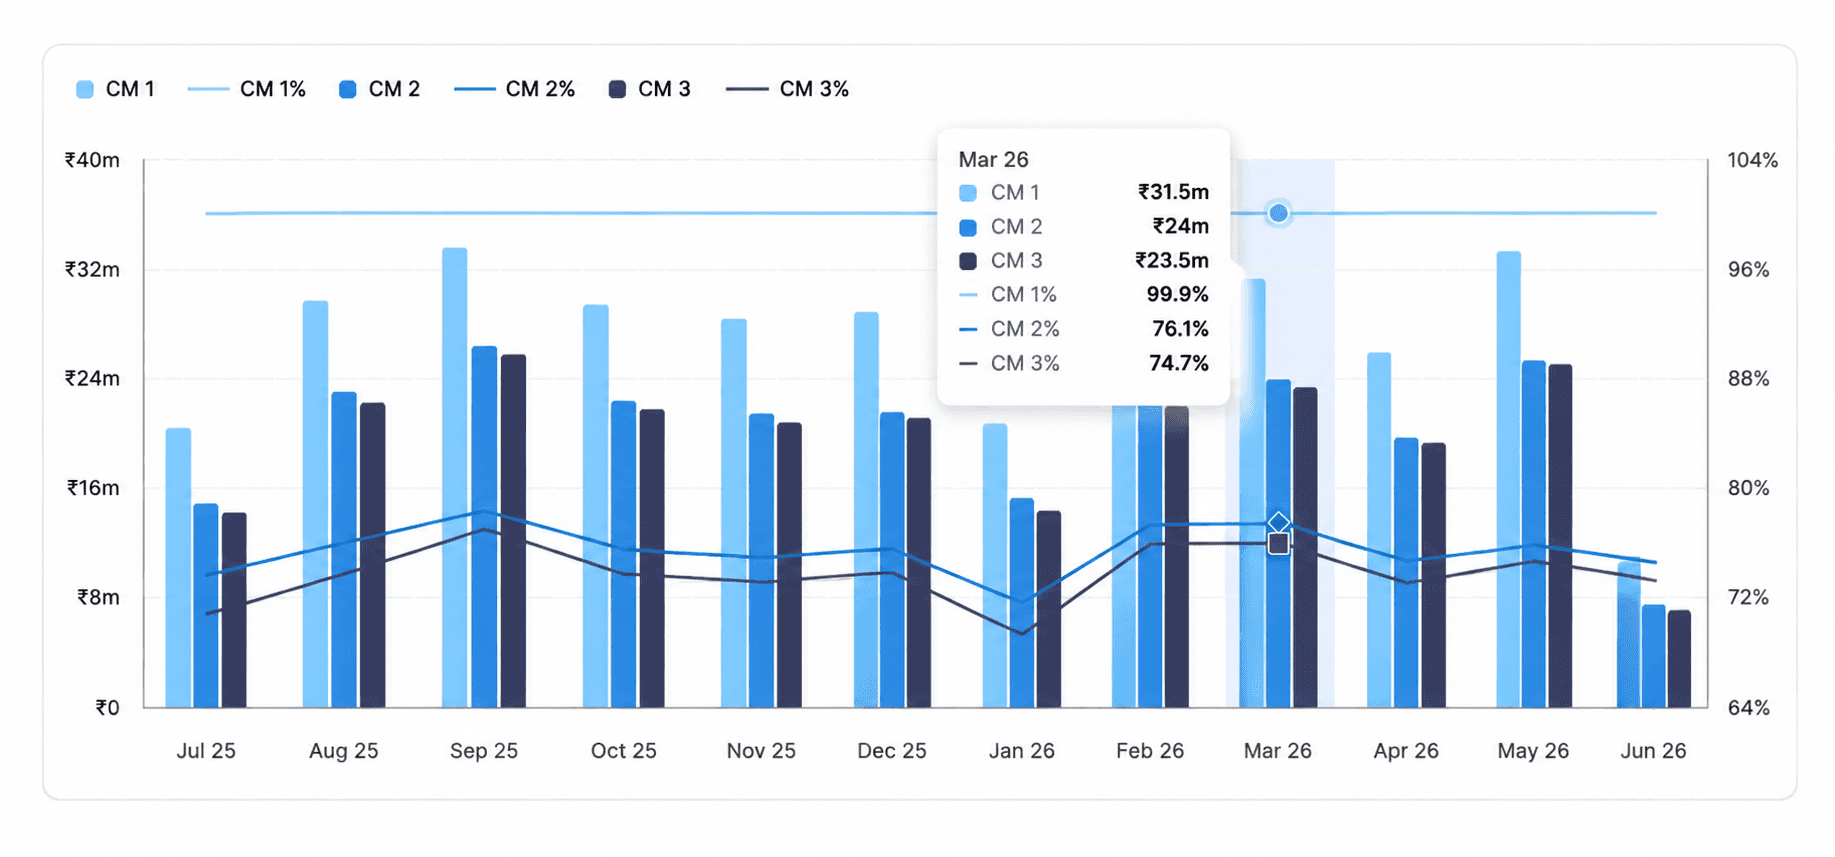
A P&L waterfall then breaks down every layer between gross revenue and net profit, including shipping labels, transaction fees, operating expenses, and refunds. Merchants can drill from store-level profit into product-level and country-level profit views.
The Difference in Practice
For a merchant who wants a single number showing how a product performs after COGS, Polar answers that. For a merchant who wants to see where each margin layer expands or leaks between the top line and net profit, Bloom's CM1 → CM2 → CM3 → net profit view is more granular. If ad spend is a large share of your P&L, CM3 is usually the metric that changes decisions.
How Each App Handles Cost and Expense Tracking
Missing costs sink profit reporting. What each app tracks automatically, and how flexible cost rules are, has a big effect on how trustworthy the final net profit number is.
Polar Analytics Cost Coverage
Polar's core cost inputs are COGS, discounts, and returns. Operating expenses (like software, agencies, or rent) can be layered in through Google Sheets, and Polar's semantic layer allows for custom metrics. Full P&L visibility is achievable, but often requires configuration outside the default flow.
Bloom Cost Coverage
Bloom automatically tracks:
Product cost (from Shopify or overridden per variant)
Shipping cost and shipping label fees
Transaction fees and payment gateway fees
Order fulfillment fees
Discounts and refunds
Operating expenses
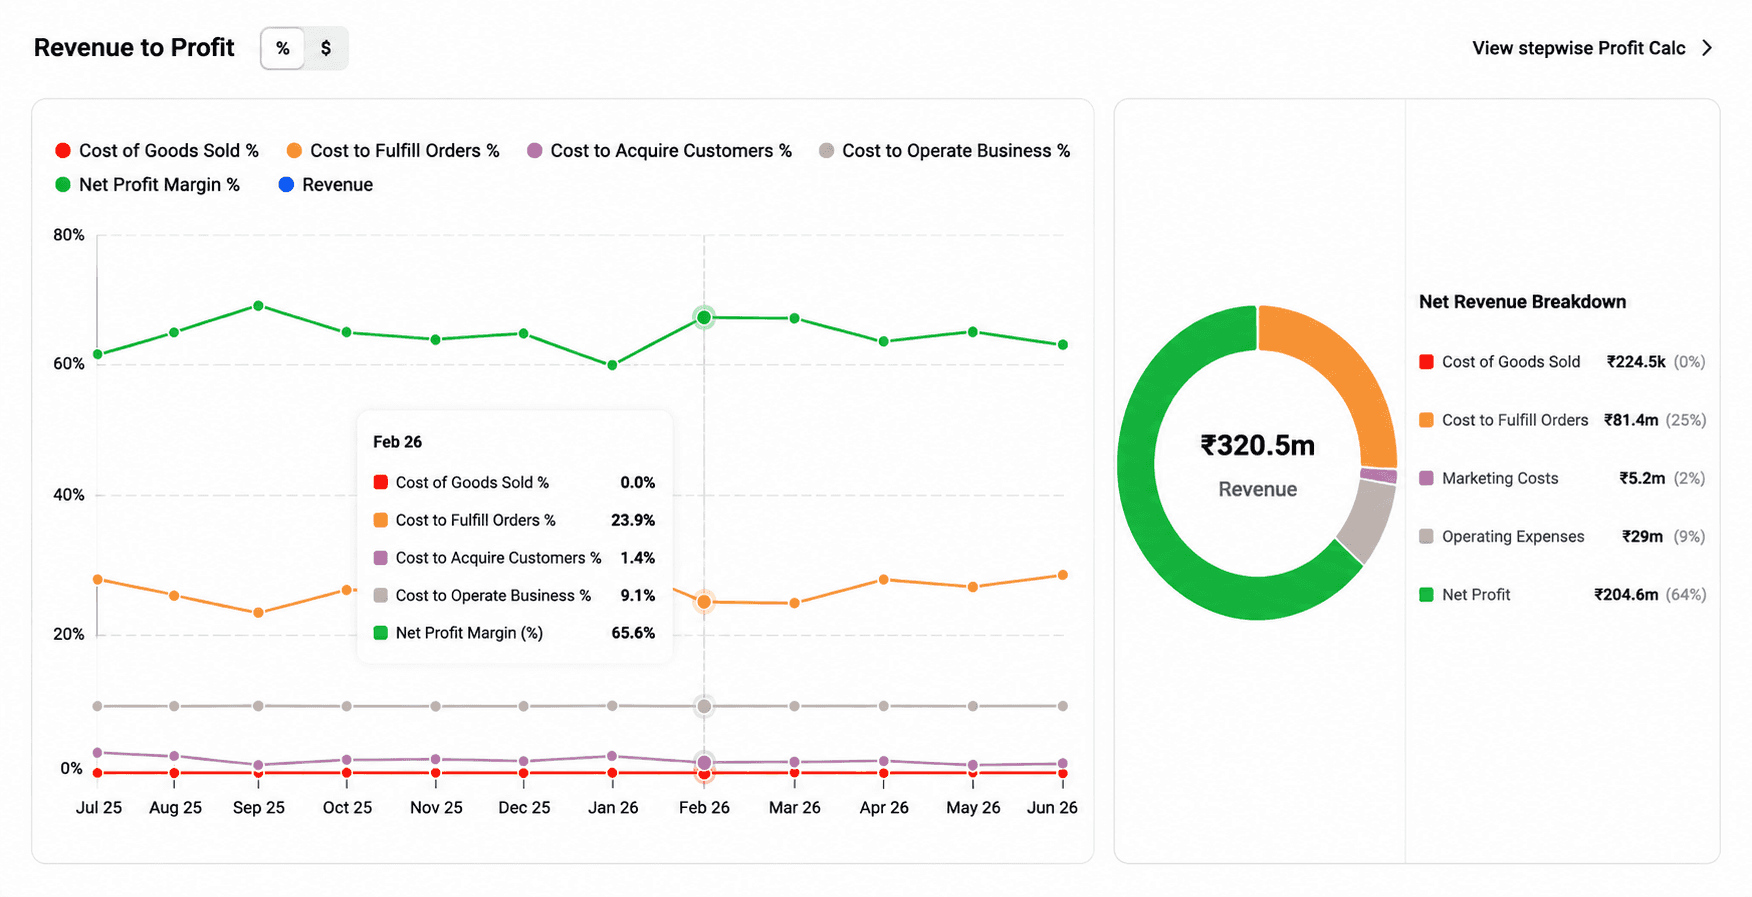
Shipping Cost rules can be set by date range and quantity. Product costs can be edited in bulk via CSV, and multiple cost values per variant let merchants track cost changes over time without recalculating history.
Which One Gives a Truer Net Profit Number
Bloom captures a wider range of variable and operating costs by default. Polar can reach similar depth, but generally through custom metric configuration or Google Sheets imports rather than out of the box. For a merchant who wants a defensible net profit number on day one, Bloom's is better.
Marketing Attribution: Polar Analytics vs Bloom
Attribution is where the two apps differ most in philosophy. Both use first-party pixels, but they take different approaches to modeling the customer journey.
Polar Analytics Attribution
Polar's server-side Polar Pixel powers a multi-touch attribution suite with 10+ models, including:
First Click
Last Click
Linear
Time Decay
U-Shaped
Full Impact
Full Paid Overlap
Full Paid Overlap + Facebook Views
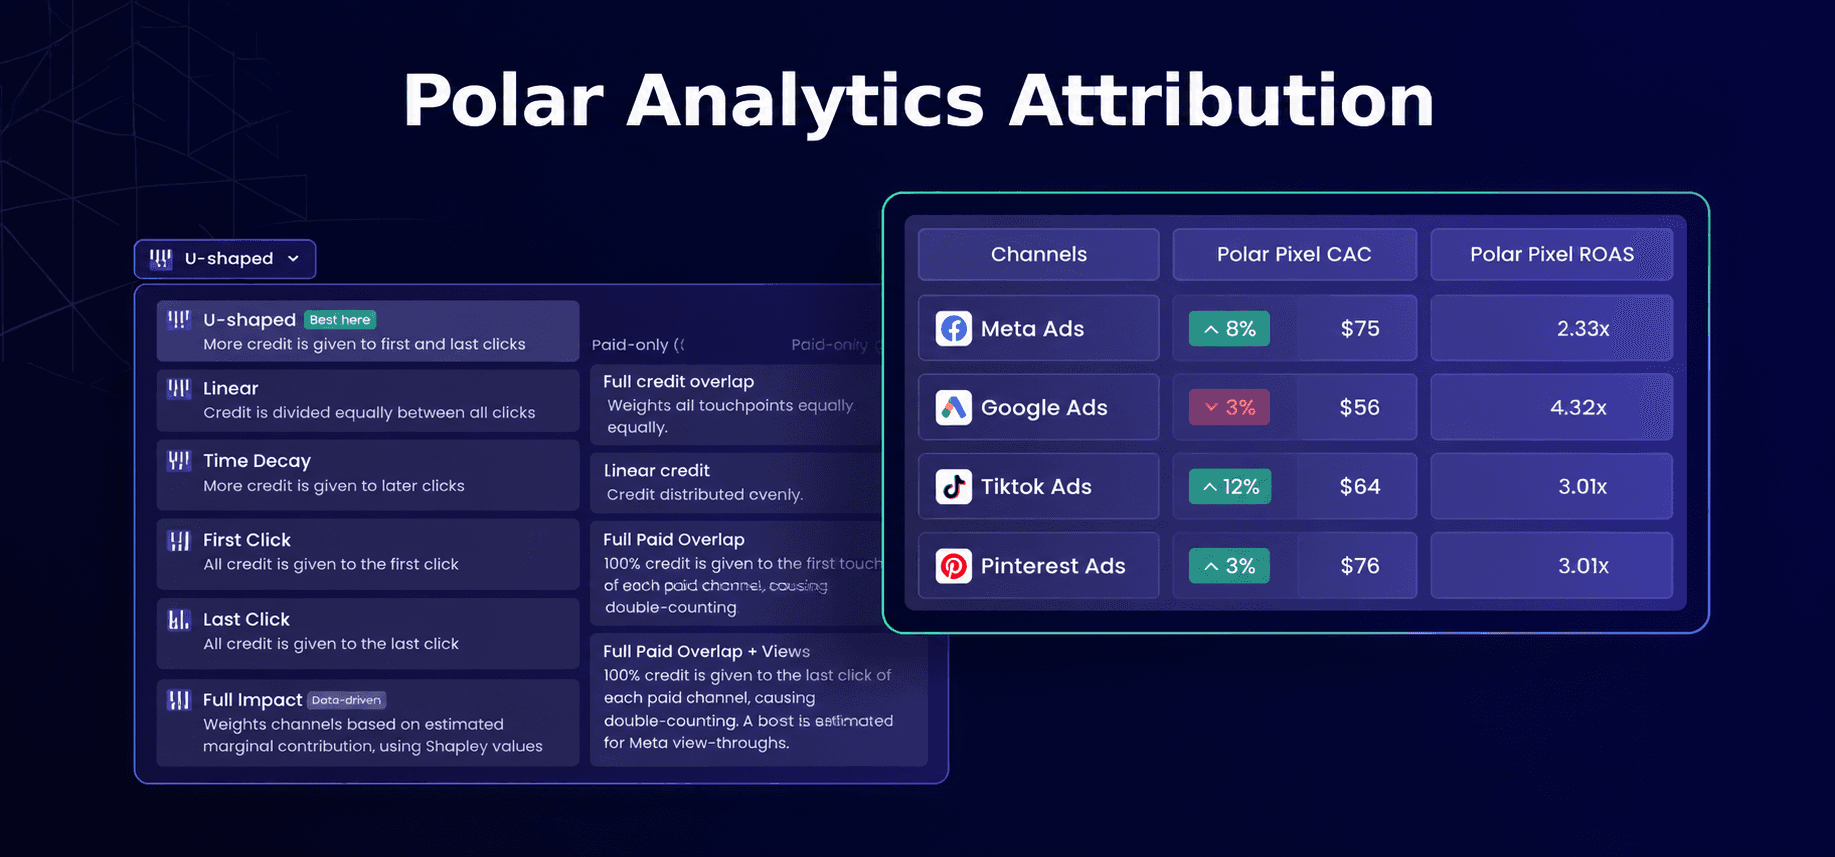
That breadth suits brands running complex omnichannel campaigns across paid social, paid search, TV, and retail, where different lenses on the same journey matter.
Bloom Attribution
The Bloom Pixel is a first-party click-based tracker with six attribution models:
Last Non-Direct Click
Last Click
First Click
Any Click
Linear
Linear Paid Only

Because tracking is first-party, it continues to capture customer interactions when browser privacy features, iOS restrictions, or ad blockers. The output feeds directly into POAS reporting so merchants can measure ad channels on profit rather than just revenue.
How to Think About the Difference
Polar gives more models, which helps sophisticated teams stress-test attribution assumptions from multiple angles. Bloom gives a models that ties them tightly to profit reporting, so the question is not just "which channel drove the sale" but "which channel drove a profitable sale." Merchants who care about ROAS may prefer Polar. Merchants who care about POAS and ROAS tend to prefer Bloom.
Integrations and Data Sources
Polar advertises multiple 1-click integrations, including Shopify, Amazon, Meta, Google, TikTok, Klaviyo, and a long tail of ad, email, and analytics platforms. Its semantic layer and Snowflake backend make it suitable for pulling in less common sources through custom connectors.
Bloom integrates with Shopify plus the platforms most Shopify merchants actually use to sell and market: Meta, Google, TikTok, Snapchat, Pinterest, Klaviyo, Omnisend, Mailchimp, and shipping partners including ShipStation and ShipHero. It is not built to consolidate every data source in a business, but it covers the ones that show up in a Shopify P&L.
Both apps expose an MCP endpoint, so tools like Claude and ChatGPT can query live commerce data through natural language.
Which Analytics App Should You Choose?
The right choice depends on what your store needs most from analytics today.
Choose Polar Analytics if…
You are an established DTC brand or agency with meaningful GMV and a dedicated data or analytics function.
You need to centralize multiple data sources into one BI environment on a dedicated Snowflake database.
You want a wide attribution model library for stress-testing marketing decisions.
You are already comfortable with a $750+/month analytics line item and want incrementality testing on top of BI.
Choose Bloom if…
Your priority is an accurate net profit number.
You want CM1, CM2, and CM3 out of the box, with a P&L waterfall that shows where margin leaks.
You want first-party attribution tied to POAS, so ad decisions are made on profit rather than revenue.
You want to start at $20/month and scale by feature access rather than pay $750+ from day one.
In the end, what truly matters is knowing how much money your business actually keeps, not just how much it earns. Make tool decisions based on their ability to show real net profit not on brand recognition or hype.
Frequently Asked Questions
How much does Polar Analytics cost on Shopify?
Polar Analytics pricing on the Shopify App Store starts at $750/month for the Core Plan, with the final price scaled by online GMV. Add-ons like incrementality testing and data activations are priced separately.
What is the cheapest alternative to Polar Analytics?
Bloom is one of the most affordable Polar Analytics alternatives for Shopify, starting at $20/month with plans at $40 and $80. It focuses on profit reporting, contribution margins, POAS, and first-party attribution.
Does Polar Analytics track true profit?
Polar Analytics tracks Contribution Margin 1 (CM1), which is profit after product costs. Deeper P&L views (after fulfillment, marketing, and operating expenses) usually require importing data through Google Sheets or configuring custom metrics.
Which app has better attribution: Polar or Bloom?
Polar offers 10+ attribution models on the server-side Polar Pixel, useful for complex omnichannel analysis. Bloom offers six first-party click-based models on the Bloom Pixel, tied directly to POAS so merchants measure channels by profit contribution. Polar has more models; Bloom has tighter alignment between attribution and profit reporting.
Can I connect Claude or ChatGPT to my analytics data?
Both apps expose an MCP endpoint. Polar MCP and the Bloom MCP each let AI assistants like Claude and ChatGPT query live commerce data through natural language, so you can ask questions like "which product has sold the most in the last quarter" and get an answer against real store data.
Discover More