Talk to most marketers or agencies and the conversation lands on ROAS: how much revenue you get back for every dollar of ad spend. You hear it quoted as a multiple, 2x, 4x, 6x, meaning the return came back that many times bigger than the spend. The problem is that a ROAS number on its own can't tell you whether it's enough to grow the business. A 4x can be a winner for one store and a slow loss for another.
That's the gap break-even ROAS (BEROAS) closes. It's the lowest ROAS at which an ad actually pays for the product it sells. Beat it and you're making money. Sit below it and every sale loses money, no matter how strong the multiple looks in a dashboard. It turns "is my ROAS good?" into the question that actually matters: "is my ROAS enough?"
To calculate it, divide the selling price by your margin after fulfillment. That single number tells you the floor a campaign has to clear before profit even begins:
Break-even ROAS = Selling price ÷ Margin after fulfillment
Example: a $100 product with a $67 margin after fulfillment has a break-even ROAS of 100 ÷ 67 = 1.5. Any ROAS above 1.5 makes money. Below it loses money.
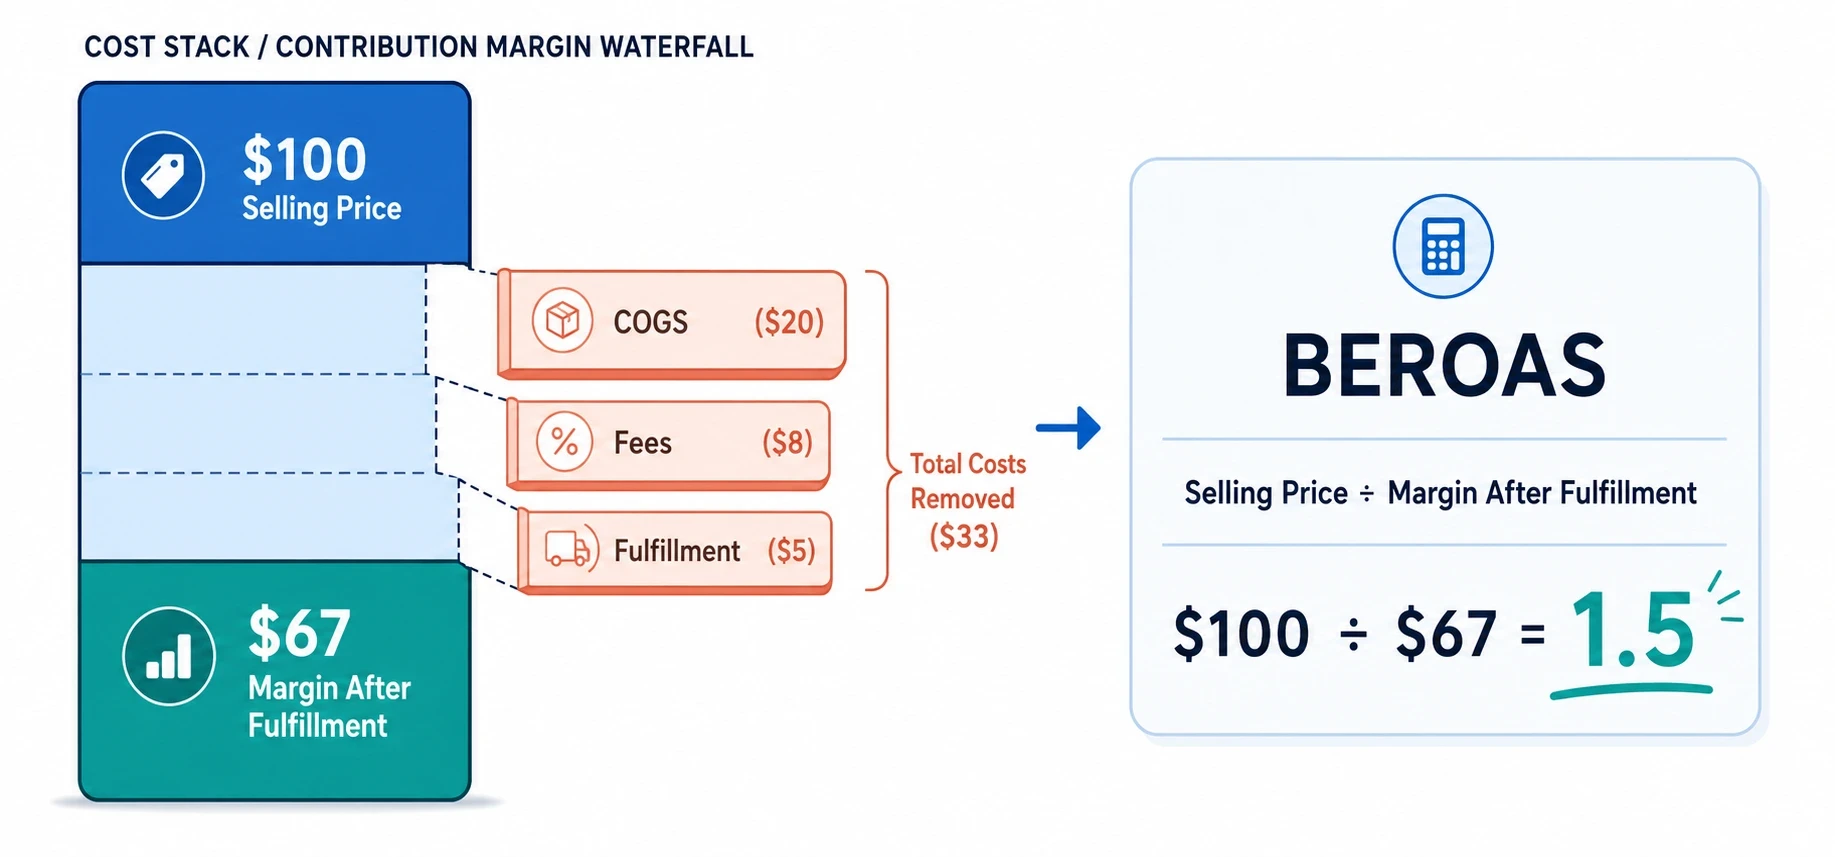
The reason a raw ROAS can mislead is simple: it counts revenue and ignores what your product cost you to source and ship. BEROAS starts from your real margin instead, which is what makes it the right lens for ad analysis. The rest of this guide shows how to calculate it for your Shopify store, how to read it at the store and product level, and how to use it to decide what to scale and what to cut.
Key Takeaways
Break-even ROAS is the lowest ROAS at which an ad pays for the product. Below it, every sale loses money.
The formula is Selling price ÷ margin after fulfillment. At the store level you can use your full margin after fulfillment (CM2). At the product level, where per-order shipping can't be assigned to one SKU, you stop at margin after product cost (CM1). Pick the right one for the level and stay consistent.
Calculate it at two levels: store-level for budget planning, product-level for deciding which campaigns to scale or kill.
The bigger your product cost, the higher your break-even ROAS, and the harder profit gets. A lower break-even target is structurally better because it leaves more headroom, and you lower it by cutting real cost, not by wishing.
Platform-reported ROAS ignores your costs, so it can look healthy while you sit below break-even. Compare actual ROAS against BEROAS, not against zero.
What is Break-Even ROAS (BEROAS)?
Break-even ROAS is the minimum return on ad spend at which a campaign covers the full variable cost of the product it sells, with zero profit left over. Spend one dollar on ads, earn back exactly enough to cover the product and its variable costs, and you've hit your BEROAS. Earn less, and the ad loses money on every order.
It's sometimes called target ROAS, because it sets the floor your campaigns have to clear. Anything above it is profit. Anything below it is a slow leak.
The key idea is that BEROAS is built from your margin, not from your revenue. Two stores can both run a campaign at 3x ROAS and end up in completely different places, because one keeps 60% of each sale before ad spend and the other keeps 25%. Same ROAS, very different break-even points.
Break Even ROAS Formula
The break-even ROAS formula is your Net Revenue divided by your Profit After Fulfillment.
BEROAS = Net Revenue ÷ Profit After Fulfillment
Both parts are plain once you name them:
Net Revenue is your selling price after any discounts and returns. For a single product at full price, net revenue and selling price are the same number.
Profit After Fulfillment is what is left after your variable costs: COGS, transaction fees, and fulfillment. It is the profit the sale carries before ad spend.
If you have seen this written as Selling price ÷ pre-ad margin, that is the same calculation. "Net Revenue" and "Profit After Fulfillment" are just the precise terms for "selling price" and "pre-ad margin." The structure does not change: BEROAS is always your revenue divided by the profit left after variable costs. Watch the video above to see this worked through end to end.
How is BEROAS Different from ROAS?
ROAS measures how much revenue an ad returns. BEROAS measures how much revenue an ad needs to return before it stops losing money. One is a result, the other is the target the result has to beat.
ROAS is total ad revenue divided by total ad spend. It tells you a campaign brought back four dollars for every dollar spent. What it doesn't tell you is whether four dollars was enough, because it ignores what the product cost you to make and ship.
BEROAS answers the "enough" question. It folds in your product cost and variable costs first, then tells you the exact ROAS at which the campaign breaks even. A 4x ROAS on a product with a 4.4x break-even target is a losing campaign, even though 4x sounds strong in a dashboard.
This is why two numbers that look identical can mean opposite things. ROAS is the speedometer. BEROAS is the speed limit. You need both on screen to know whether you're safe.
What Costs Go into Your Break-Even ROAS?
BEROAS is built from your margin after fulfillment, which is your selling price minus every variable cost except ad spend. For most Shopify stores those costs are product cost (COGS), payment transaction fees, and shipping and handling. In that order, here's how they eat into a sale:
Product cost (COGS): what you paid for the unit. For most stores, the single biggest driver of BEROAS.
Transaction fees: the payment processor's cut, typically around 2% to 3% of order value depending on your plan and gateway (Shopify's pricing page lists current rates by plan).
Shipping and handling: the real cost to pick, pack, and ship the order. This is the one that decides which margin you build on.
The shipping decision matters more than it looks, and it's where most break-even math quietly goes wrong. If you track shipping per order, which most stores do because the carrier charges per shipment and not per SKU, you can't cleanly assign a fulfillment cost to a single product. So your product-level BEROAS is built on margin after product cost (CM1), the selling price minus COGS and fees, and you handle shipping at the store level. If you genuinely track fulfillment per product, you can build on the full margin after fulfillment (CM2) and get a tighter target.
What you should not do is split an order-level shipping cost across products and call it precise. An estimate dressed up as a number will set a break-even target you can't trust.
How to Calculate Break-Even ROAS Step by Step
To calculate break-even ROAS, divide your selling price by your margin in dollars. That margin is what's left after you subtract every variable cost the product carries before ad spend. The result is the ROAS your ads have to clear to break even on that product.
The process:
Start with the selling price. Use the actual price the customer pays, after any standard discount you run.
Subtract your variable costs. Product cost, transaction fee, and (if you track it per product) fulfillment. What remains is your margin in dollars.
Divide the selling price by that margin. Selling price ÷ margin = BEROAS.
A quick worked example. A product sells for $100. Product cost is $30, the transaction fee is about $3, and you don't track fulfillment per product, so you stop at margin after product cost.
Margin after product cost = $100 − $30 − $3 = $67
Break-even ROAS = $100 ÷ $67 = 1.5
So this product needs a ROAS above 1.5 for the ads to make money. At exactly 1.5, the ads pay for the product and nothing else. At 3x, you're clearing the bar with a healthy room to spend more.
Should You Calculate Break-even ROAS at the Store or Product Level?
Both, for different jobs. Store-level BEROAS is for budget planning and seeing the whole picture. Product-level BEROAS is for deciding which specific campaigns to scale, hold, or cut.
Store-level rolls every product, fee, and shipping cost into one blended target for the whole store. It's the right tool for setting an overall ad budget and tracking month-to-month health, and because you know your real total shipping spend at the store level, you can build it on your full margin after fulfillment.
Product-level breaks the target down per SKU, where your actual margins live. This is where you find out that your best-selling product is barely clearing break-even while a quieter SKU has room to triple its spend. Store-level numbers hide this. Product-level numbers expose it.
The pattern most operators fall into is managing ads at the store level and wondering why a healthy blended ROAS isn't turning into bank-balance profit. The answer is usually a couple of high-spend products sitting below their own break-even, dragging the average.
Store level: A Three-Month Example
Watch how the story changes once you add the break-even line to a store's quarter.
Line item | June | July | August |
Sales | $80,000 | $90,000 | $100,000 |
COGS | $20,000 | $40,000 | $52,000 |
Transaction fees (3%) | $2,400 | $2,700 | $3,000 |
Shipping and handling | $5,000 | $5,500 | $6,000 |
Margin after fulfillment (CM2) | $52,600 | $41,800 | $39,000 |
Break-even ROAS | 1.52 | 2.15 | 2.56 |
Ad spend | $20,000 | $33,000 | $40,000 |
Blended ROAS | 4.0 | 2.7 | 2.5 |
June is a strong month. COGS is low, so the margin after fulfillment is fat ($52,600 on $80K of sales), the break-even target is a comfortable 1.52, and the store runs at 4x. That's roughly 2.6 times the break-even line. Plenty of room.
By August, sales are at their highest, but COGS has climbed to $52,000. That pushes the break-even target up to 2.56, while actual ROAS has slipped to 2.5. The store is now running below break-even on its blended ads, even though revenue is at a quarterly high and 2.5x still looks fine in a platform dashboard.
The numbers reconcile cleanly. For August: $100,000 ÷ ($100,000 − $52,000 − $3,000 − $6,000) = $100,000 ÷ $39,000 = 2.56. That's the line the 2.5x ROAS fails to clear.
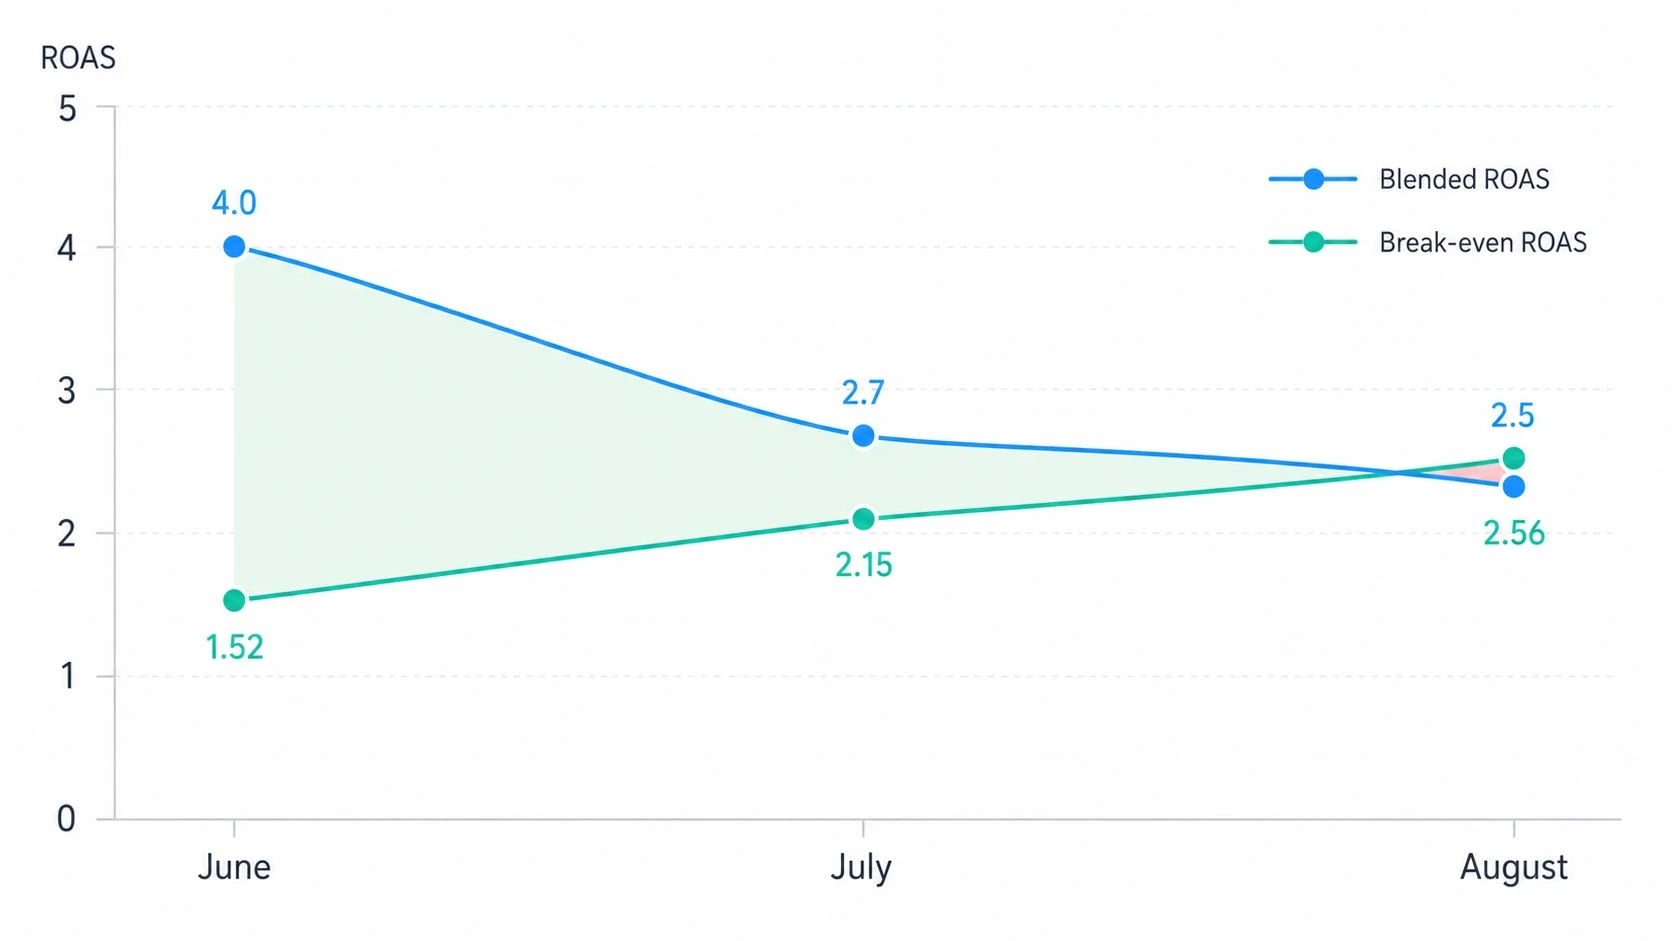
The lesson is blunt: your COGS sets your break-even target. The higher your product cost climbs, the higher your ads have to perform just to stay even, and there's a point where the target gets impractical to hit. Rising sales didn't save August. Rising COGS sank it.
Product level: where the real decisions happen
Store-level tells you something is wrong in August. It doesn't tell you which product. For that you go to the SKU level, where each product carries its own cost structure and you build on margin after product cost.
Line item | Product 1 | Product 2 | Product 3 |
Selling price | $100 | $80 | $120 |
Product cost | $30 | $47 | $80 |
Transaction fee (3%) | $3 | $2.40 | $3.60 |
Margin after product cost (CM1) | $67 | $30.60 | $36.40 |
Break-even ROAS | 1.49 | 2.61 | 3.30 |
Ad spend | $30 | $20 | $50 |
Product ROAS | 3.3 | 4.0 | 2.4 |
Three products, three completely different situations:
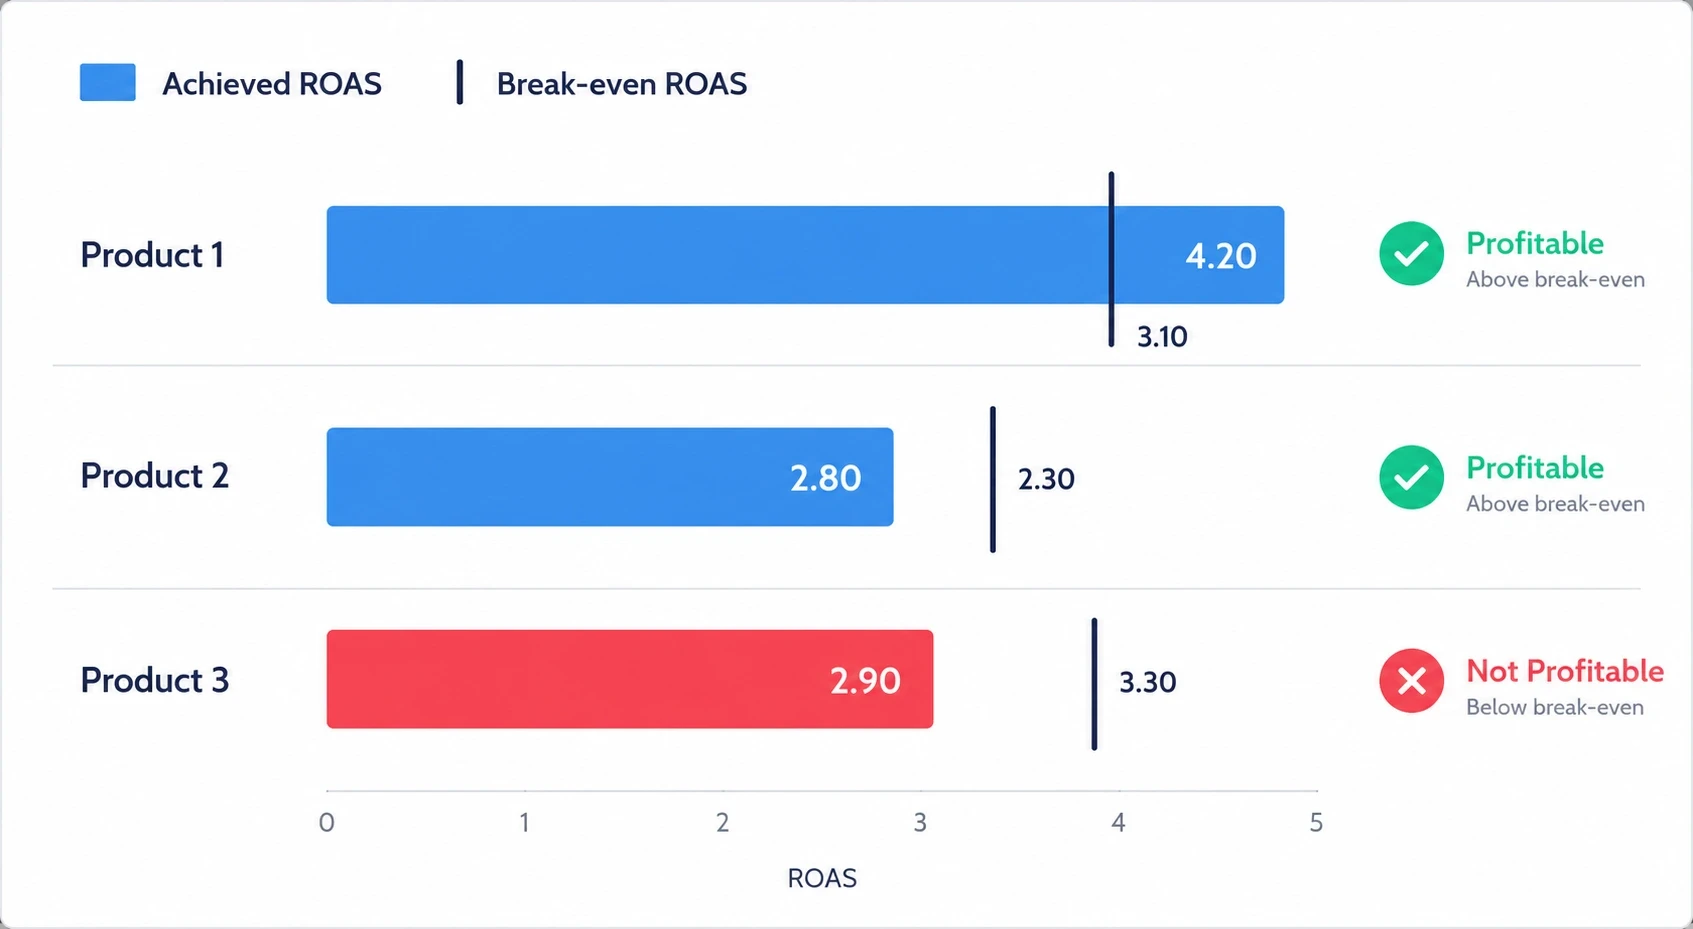
Product 1 is the workhorse. Sourced cheaply ($30 on a $100 price), so the break-even target is a low 1.49 and it's running at 3.3x, more than double break-even. This is where you push more budget.
Product 2 looks healthy at 4.0x and it's clearing its 2.61 break-even, but the high product cost ($47) means a thin margin. It's profitable, with less headroom than the raw 4x suggests. Scale it carefully.
Product 3 is the trap. The 2.4x ROAS passes a casual glance, but its break-even is 3.30 because the product costs $80 to source. It's losing money on every order at the current spend, and at $50 it's the highest-spend product of the three. Left alone, a product like this quietly drags down the whole store. This is exactly what reads as "fine" on a platform dashboard and shows up as a leak only when you put the break-even line next to it.
Put the two tables together and August's mystery solves itself. The blended ROAS dipped below break-even because spend was concentrated on products like #3, where the real margin couldn't support it.
How to Read Break-Even ROAS Once You Have It
Once you have a break-even target, reading your actual ROAS against it gives you a clear verdict. The cleanest way to think about it is as a ratio, actual ROAS divided by break-even ROAS:
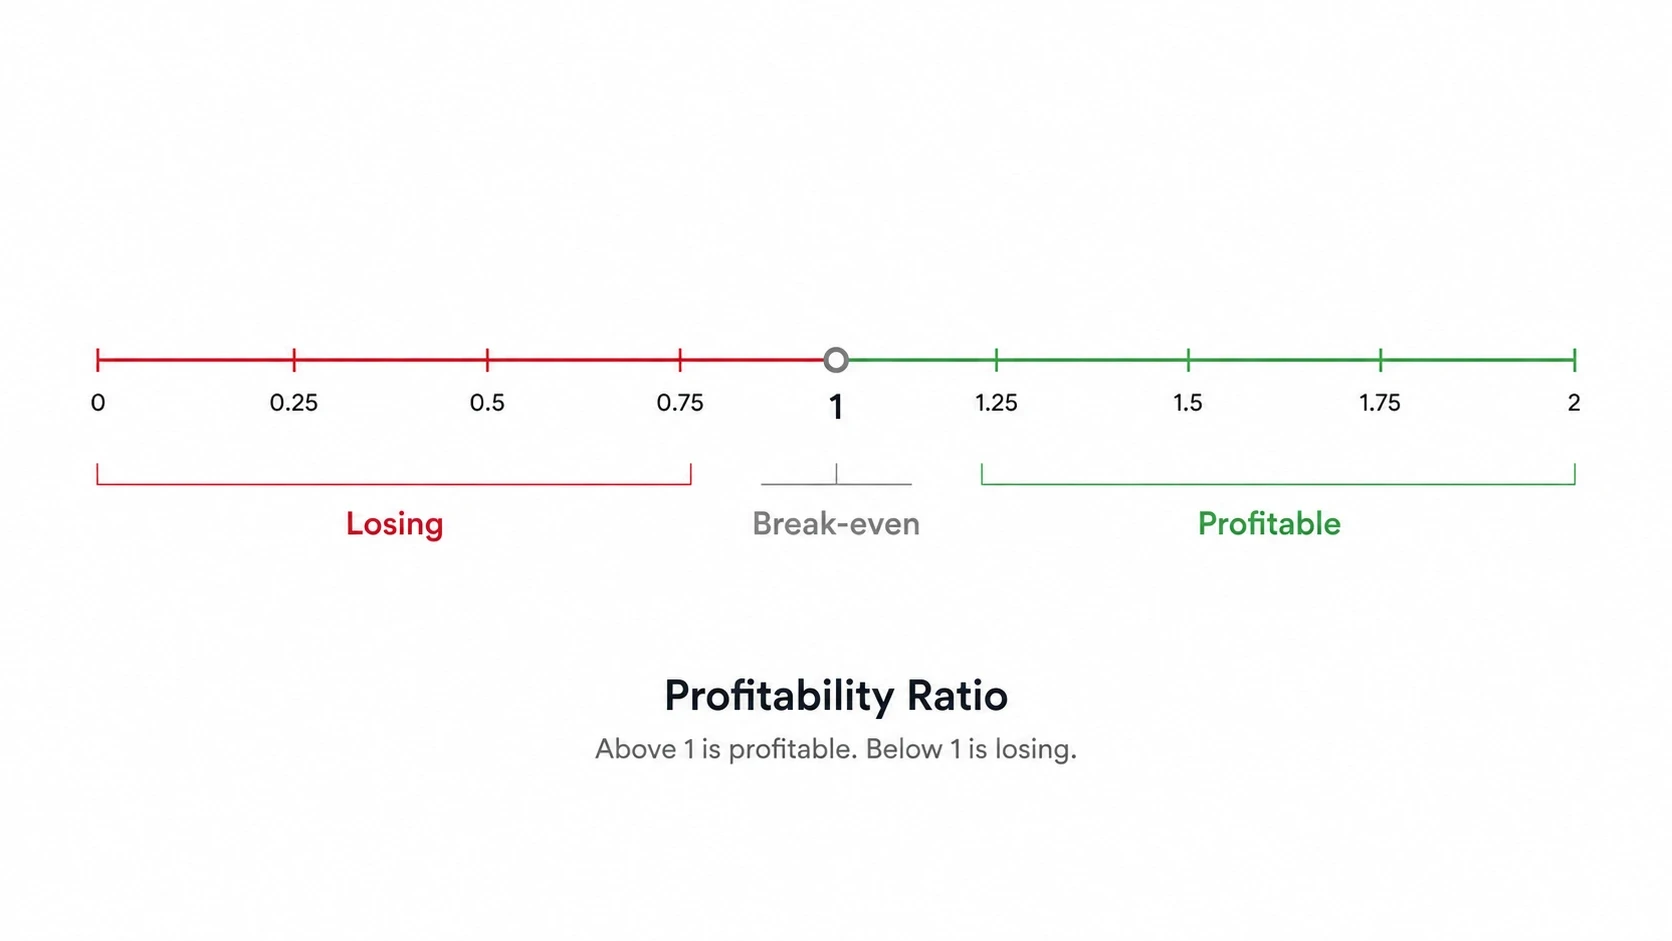
Ratio above 1: profitable. Your ROAS is beating the break-even target, and the bigger the gap, the more room you have to scale.
Ratio of exactly 1: costs covered precisely. This is break-even. The ad has paid for the product and nothing more, no profit and no loss. It's a hold-and-watch zone, or a signal to tighten targeting before you spend more.
Ratio below 1: losing money on every conversion. Cut spend, fix the cost structure, or pause the campaign.
One caution that applies even when the ratio is above 1: clearing BEROAS means the ad paid for the product, not that the business made money. You still have operating expenses (software, labor, rent) waiting after the variable costs. A product can beat its break-even target and still leave too little to cover overhead if you spend right up to the line. The healthy move is to keep a margin buffer above break-even, not to spend until ROAS and BEROAS touch.
This is also the cleanest reason to stop trusting platform ROAS as a profit signal. Meta and Google report ROAS from revenue, with no idea what your product or shipping cost. The platform will happily call a 4x campaign a winner while it sits below a 4.4x break-even. The number isn't lying about revenue. It's just silent about cost, and cost is the whole game.

Where Do The Numbers Come From for a Shopify Store?
Every input BEROAS needs already lives in your Shopify data, just scattered across places that don't talk to each other. Order revenue and product prices sit in Shopify. Real COGS sit in your product cost fields or a supplier sheet. Ad spend sits in Meta, Google, and TikTok. Shipping cost sits with your carrier or 3PL.
Calculating BEROAS by hand means pulling all of that into a spreadsheet, refreshing it constantly, and redoing the math every time costs change. For one product it's manageable. For a full catalog across three ad platforms, it falls apart fast, and the spreadsheet is usually out of date by the time you act on it. From what we've seen, that lag is the real killer: the leak is a month old before anyone spots it.
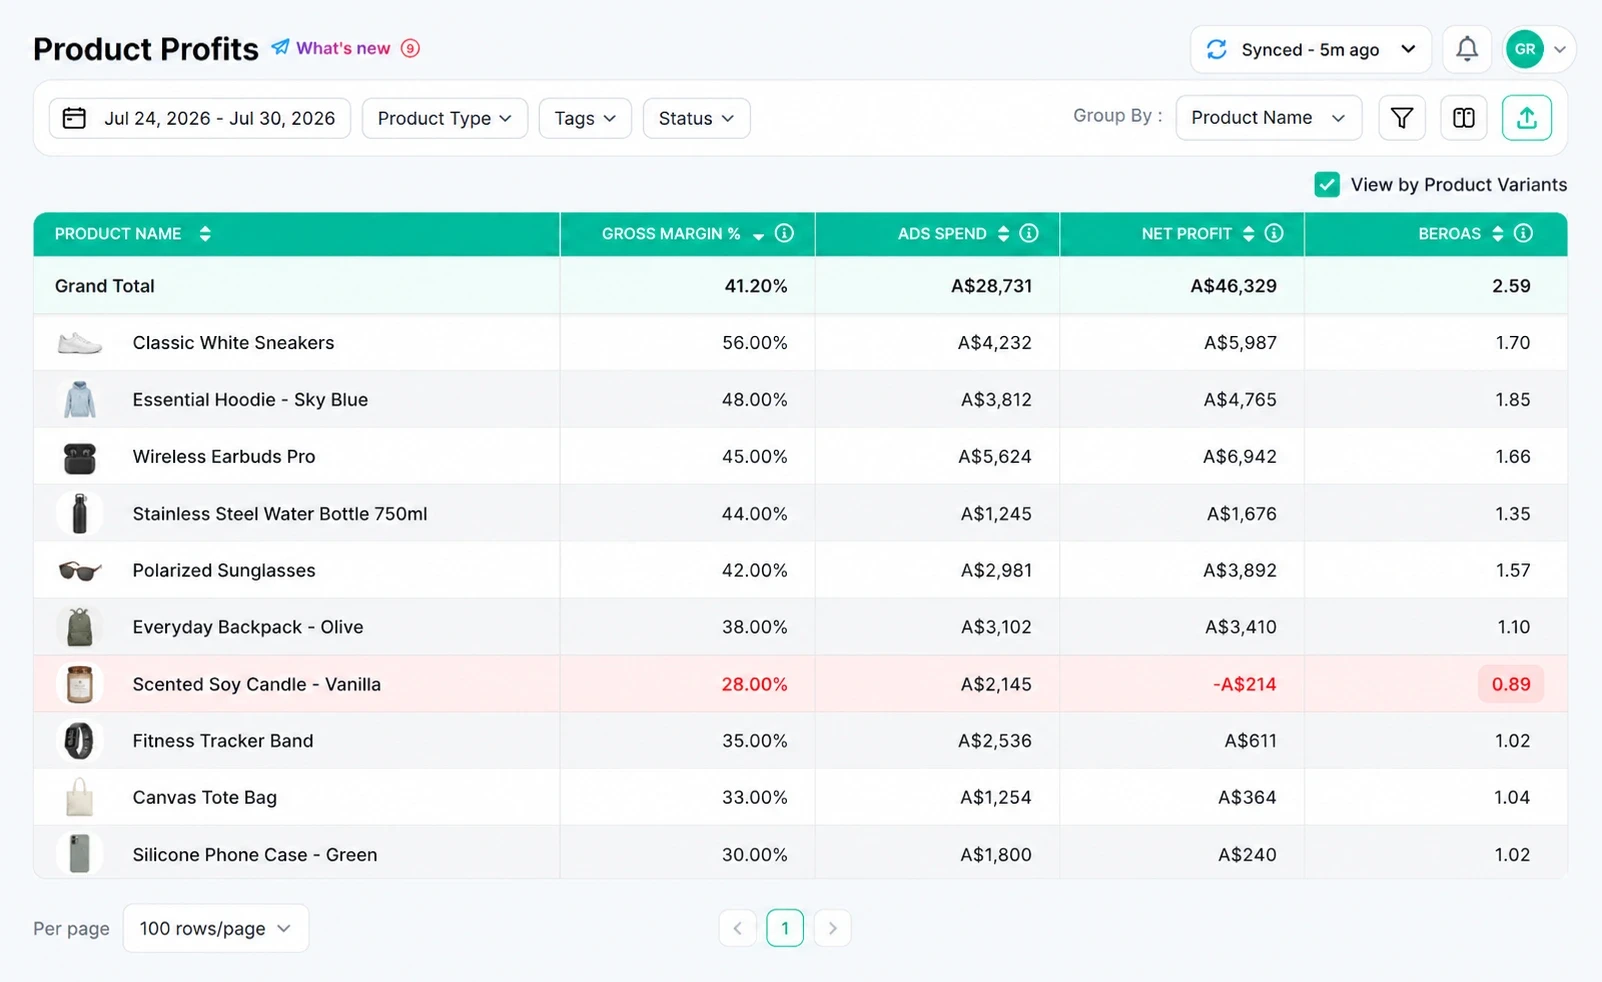
This is the problem Bloom was built for a profit and attribution app for Shopify stores, pulls real COGS, transaction fees, shipping, and ad spend into one view and calculates break-even ROAS per product automatically. Instead of maintaining a sheet, you see which SKUs are clearing their break-even target and which are sitting below it, with the gap spelled out for each one. If you want to understand the margin layers underneath it, our breakdown of pillar on contribution margin, margin after fulfillment to net profit walks through where each cost drops out, and how to set up real COGS in Shopify covers getting the biggest input right.
It also surfaces the platform-versus-real gap directly, which we cover in platform ROAS vs real ROAS, so you can see where a campaign's reported ROAS sits above the break-even your margins actually require, and where it doesn't.
Lower Your Break-Even ROAS to Protect Your Profit
The single most useful thing the BEROAS lens teaches is that your break-even target isn't fixed. It's set by your costs, and costs are something you can work on. A lower break-even target is structurally better, not as a vanity number, but because it widens the gap between the target and the ROAS you're already hitting, and that gap is your profit.
Every dollar you take out of product cost lowers the target. A product that needs 3.3x to break even becomes a product that needs 2.5x if you renegotiate sourcing, and suddenly campaigns that were losing money are profitable without changing a single ad. The same goes for shipping and fees, though COGS is usually the biggest lever.
So the playbook is straightforward. Calculate BEROAS before you set budgets, not after. Watch it at the product level, not just the store level. Keep a buffer above break-even so operating costs have somewhere to come from. And keep pressure on the costs that set the target in the first place. There's a discipline to this beyond the math, which is why we lay out the 3-Gate scale decision and why you should never scale on ROAS alone. Get those right, and every profitable conversion is an edge your competitors running on raw ROAS don't have.
If you want to see your real break-even target by product without building a spreadsheet, Bloom has a free trial that installs on Shopify in a couple of minutes. If you'd rather have someone walk through your store's numbers with you first, the consultation call is free too.
Frequently Asked questions
What is a good break-even ROAS?
There's no universal "good" number, because break-even ROAS is set by your margins, not by a benchmark. A store with low product costs might sit at a healthy 1.5, while a store with expensive sourcing could be at 4 or higher. Lower is better in the sense that it leaves more headroom, but the real goal is keeping your actual ROAS comfortably above whatever your break-even happens to be.
Is break-even ROAS the same as target ROAS?
They're often used interchangeably, and the math is the same. Break-even ROAS is the point of zero profit, the absolute floor. "Target ROAS" sometimes means exactly that floor and sometimes means a goal set above it with a profit buffer built in. If someone hands you a target ROAS, ask whether it's the break-even point or a profit target above it, because the two lead to very different spending decisions.
Should I calculate break-even ROAS at the store level or the product level?
Both, for different jobs. Store-level is for overall budget planning and tracking month-to-month health. Product-level is for deciding which specific campaigns to scale or cut, because each product carries its own margin. A healthy store-level ROAS can hide individual products losing money, so the product level is where the real spending decisions get made.
Does a high ROAS mean I am profitable?
Not necessarily. A high ROAS only means the ad returned a lot of revenue, not that the revenue covered your costs. A 5x ROAS on a product with a 6x break-even target is still a loss on every sale. Profitability depends on whether your ROAS clears your break-even ROAS, and on leaving enough margin afterward to cover operating expenses like software, labor, and rent.
Discover More