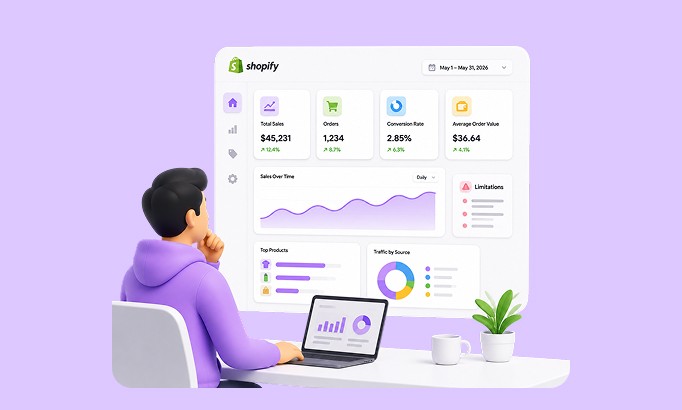


The Shopify Analytics Dashboard gives merchants a central place to review and evaluate the store performance, compare results across time periods, and explore reports for different areas of the business. It is useful for tracking essential metrics and identifying broad trends, especially for merchants who need a quick overview of what is happening in their store.
The dashboard is undeniably easy to use, However, as reporting needs become more detailed, merchants may require deeper analysis, greater customization, or data from multiple channels in one place to translate them into actionable decisions
This guide explains how the Shopify Analytics Dashboard works, the features and metrics merchants use most, the improvements in the new dashboard, its practical limitations, and how Bloom Analytics closes that gap with unified, decision-ready insights.
What is a Shopify Analytics Dashboard?

A Shopify Analytics Dashboard is a built-in reporting area within the Shopify admin that helps merchants understand how their online store is performing. It brings important business data into one place, making it easier to monitor sales, orders, website traffic, conversion rates, customer activity, and inventory trends.
The dashboard presents information through metric cards, charts, and reports. Merchants can change date ranges, compare current results with previous periods, and focus on specific areas of the business. For example, they can review which products are selling well, where customers are coming from, how many visitors complete a purchase, and whether sales are increasing or declining.
Shopify also provides more detailed reports for sales, products, customers, marketing, finances, inventory, and store behaviour. Depending on the Shopify plan, merchants may have access to additional reporting and customization options.
In practical terms, the Shopify Analytics Dashboard helps store owners answer everyday questions such as: How much did the store sell today? Which products generated the most revenue? Is the conversion rate improving? Which marketing channels are bringing customers?
It provides a useful starting point for tracking performance, identifying trends, and making informed decisions based on store data.
Getting Started with the Shopify Analytics Dashboard

Shopify Analytics is available directly inside your Shopify admin, so you do not need to install a separate tool to view your store data.
Start by logging in to your Shopify admin and selecting Analytics from the left-hand menu. This opens the overview dashboard, where you can see key metrics such as sales, orders, sessions, conversion rate, and average order value.
From there, choose the view that matches what you want to understand:
Use the Overview Dashboard for a quick summary of store performance.
Open Reports to explore sales, customers, marketing, products, inventory, and finances in more detail.
Select Live View to monitor current visitors and order activity.
Before reviewing the numbers, set the correct date range and compare it with a previous period. You can also apply filters or adjust the report to focus on a specific product, channel, market, or customer group.
The reports and customization options available may vary by Shopify plan, but the same approach applies: start with the overview, identify a change, and then open the relevant report to investigate it further.
Key Features of Shopify Analytics Dashboard
Most Shopify merchants use a few core analytics features to monitor performance, understand customer activity, and review changes across their store.
Overview Dashboard
The overview dashboard brings important store metrics into one place, including total sales, orders, sessions, conversion rate, and average order value. Merchants can quickly check how the store is performing without opening multiple reports. It is especially useful for daily monitoring and identifying sudden changes that may need further investigation.
Sales Reports
Shopify sales reports allow merchants to review sales by product, variant, customer, location, channel, discount, and time period. These reports help reveal which products or channels generate the most revenue. Merchants can also use them to study returns, discounts, taxes, and other factors that affect overall sales performance.
Date and Period Comparisons
Merchants can compare store performance across different dates, such as this month versus last month or the current year versus the previous year. These comparisons make it easier to identify growth, declines, and seasonal patterns. They also provide context, helping merchants understand whether a result is strong or weak compared with an earlier period.
Product and Inventory Analytics
Product reports help merchants identify best-selling products, underperforming items, and changes in product demand. Inventory reports provide information about available stock, sell-through rates, and inventory levels across locations. Together, these insights help merchants plan restocking, avoid stockouts, and reduce excess inventory.
Customer and Traffic Reports
Customer reports show information about new and returning customers, purchase behaviour, and order value. Traffic and acquisition reports explain where store visitors come from, including search engines, social media, direct visits, and referral sources. Merchants can use this data to understand which audiences and traffic sources contribute most to store activity.
Live View
Live View displays current activity happening across the online store, such as active visitors, sessions, and recent orders. Merchants often use it during product launches, promotional campaigns, or high-traffic sales events. It provides a quick visual view of how customers are interacting with the store at that moment.
Report Customization
Shopify allows merchants to adjust reports using metrics, dimensions, filters, date ranges, and grouping options. This helps them narrow the data to specific products, locations, customers, or sales channels. Customized reports can make standard store data more relevant to a merchant's individual reporting needs.
Report Exports
Merchants can export report data for further analysis, record-keeping, or sharing with others. Exported files can be used in spreadsheet tools for additional calculations, formatting, or combining data with information from other sources. This is useful when working with accountants, team members, agencies, or external partners.
Together, these features give merchants a practical way to monitor daily performance, explore important trends, and identify areas that may require attention.
New Shopify Analytics Dashboard - Overview
Customizable Dashboard
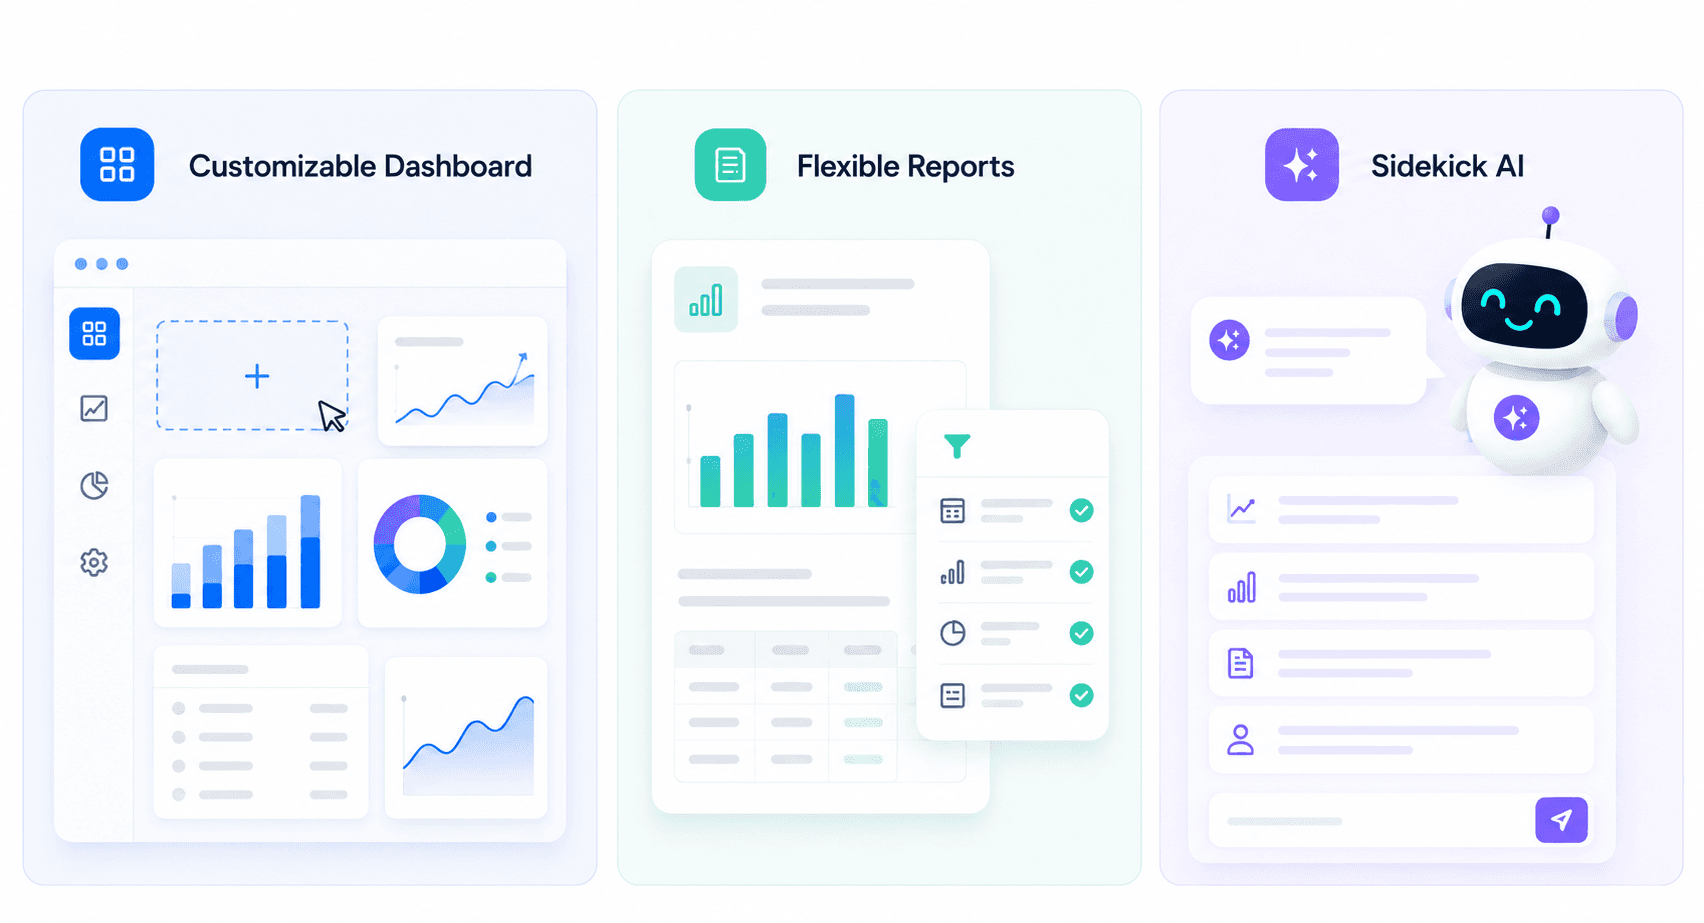
Shopify's new Analytics experience makes reporting more flexible and easier to explore. The revamped dashboard gives you a customizable overview with automated insights surfaced right on your Home feed, presenting important metrics through cards, charts, and AI-generated summaries. Merchants can drag and drop metric cards (Sales, Sessions, Fulfillments), adjust date ranges, compare periods, apply quick filters, and organize the dashboard around the metrics they review most often.
Flexible Reports
The redesigned reports include a configuration panel, data table, visualizations, and the ShopifyQL query editor. Merchants can add metrics and dimensions, filter results by metafields, choose from 15+ visualization formats, and create custom data explorations for more specific business questions. Reports can also trigger automated tasks in Shopify Flow based on the data, turning insights into action without leaving the platform.
Sidekick AI
An AI-assisted layer to reporting. Merchants can describe the data they want to explore in everyday language, and Sidekick can generate or refine a ShopifyQL query, making it easier to build reports without writing the full query manually. Sidekick also provides guidance based on the store data and permissions available to each staff member.
Limitations Merchants Face in Native Dashboard
Shopify Analytics provides a useful overview of store performance, but merchants may encounter limitations as their reporting needs become more complex.
Limited data depth: Standard reports cover common metrics, but detailed calculations involving costs, profit margins, custom expenses, or operational data may require additional work.
Restricted flexibility: Merchants can modify metrics, dimensions, filters, and ShopifyQL queries, but reporting is still limited to the fields and relationships supported by Shopify.
Single-store limitations: Consolidated multi-store reporting is available only on Shopify Plus and Enterprise plans, making it harder for other merchants to analyze several stores together.
Reporting discrepancies: Sales, customer, session, and marketing figures may differ between Shopify reports and third-party platforms because of attribution models, tracking methods, privacy settings, refunds, and data-processing logic.
Manual data consolidation: Combining Shopify data with advertising costs, shipping expenses, marketplaces, accounting platforms, or other business tools often requires spreadsheets or third-party apps.
These limitations may not affect merchants who only need a basic overview of store performance. However, businesses managing multiple stores, marketing channels, expenses, and product lines often need a more connected view of their data. This is where platforms such as Bloom Analytics become useful, offering deeper profitability insights, broader data integration.
What Merchants Find Useful in the Bloom Analytics Dashboard
Merchants often turn to Bloom Analytics when they need a clearer and more connected view of business performance. Instead of reviewing sales, marketing, expenses, and profitability in separate tools, Bloom brings these data points together in one dashboard.
Unified View
Bloom's unified performance view helps merchants understand how revenue, costs, advertising, and store activity influence overall results. This makes it easier to move beyond top-line sales and focus on what is actually contributing to profit.
Profit Reporting
Bloom supports profit-focused reporting by tracking metrics such as net profit, product margins, advertising spend, shipping costs, transaction fees, and other operating expenses, giving merchants a more realistic picture of business performance.
Custom Dashboards
With custom dashboards and reports, users can choose the metrics, filters, dimensions, and breakdowns that match their reporting needs. Merchants can also analyse products and marketing channels to identify which items, campaigns, or customer segments generate stronger returns.
Marketing Attribution
Bloom connects ad spend across Meta, Google, TikTok, Snapchat, and Pinterest to actual orders through the Bloom Pixel, so merchants can see which channels, campaigns, and creatives are driving profitable revenue rather than just clicks or top-of-funnel conversions.
Multi-Store Analysis
For businesses operating more than one Shopify store, Bloom's multi-store analysis combines stores, markets, and currencies into a consolidated view, reducing the need for manual spreadsheets and making it easier to understand the factors affecting revenue, costs, and profitability.
Overall, these capabilities reduce the need for manual spreadsheets and make it easier to understand the factors affecting revenue, costs, and profitability.
Conclusion
The Shopify Analytics Dashboard remains a strong starting point for tracking sales, sessions, and store activity, and the new dashboard with ShopifyQL and Sidekick makes exploration more flexible than ever.
But once a business grows past basic monitoring, gaps around profit depth, cost consolidation, and multi-store visibility become harder to ignore.
This is where Bloom Analytics fits in, turning scattered sales and expense data into a single, profit-focused view.
For merchants who need more than an overview, pairing Shopify's native reporting with Bloom's unified dashboard is the practical next step toward clearer, more actionable decisions.
FAQ
What is the Shopify Analytics Dashboard used for?
It is a built-in reporting area within the Shopify admin that helps merchants monitor sales, orders, website traffic, conversion rates, customer activity, and inventory trends in one place. It is especially useful for merchants who need a quick overview of store performance and broad trends.
How do I access the Shopify Analytics Dashboard?
Log in to your Shopify admin and select Analytics from the left-hand menu. This opens the overview dashboard, where you can view key metrics such as sales, orders, sessions, conversion rate, and average order value, then dig deeper through Reports or Live View.
What's new in the updated Shopify Analytics Dashboard?
The new version includes customizable cards, charts, and automated insights, along with a configuration panel, data table, and the ShopifyQL query editor. It also introduces Sidekick, an AI-assisted layer that can generate or refine ShopifyQL queries from plain-language descriptions.
What are the main limitations of the native Shopify Analytics Dashboard?
Merchants often run into limited data depth for costs and profit margins, restricted reporting flexibility, single-store limitations outside Shopify Plus and Enterprise, discrepancies between Shopify and third-party figures, and the need for manual data consolidation across tools.
How does Bloom Analytics address these gaps?
Bloom brings sales, marketing, expenses, and profitability into one unified dashboard, with profit-focused reporting on metrics like net profit, product margins, and operating expenses. It also supports multi-store analysis, combining stores, markets, and currencies into a consolidated view.
Discover More