How to Calculate Profit on Shopify (The Complete Guide)
Learn how to accurately calculate net profit for Shopify store and understand how each operational cost affects overall profitability.

As a Shopify seller, you already know you need to calculate the profit margin of your store. The reasons are obvious: track profit and loss, grow margins, fix what's draining profitability, and finally see how much money you actually keep. How much ends up in your bank account, not just on a dashboard.
But for most sellers, the number on screen doesn't match the number in the bank. Some stop at gross profit because that's where Shopify's native reports end. Others never consolidate all their costs into a single view, so they never arrive at true net profit. And even the ones who do get to a net number often can't tell where the margin is leaking or what to fix first.
To calculate profit on Shopify accurately, you need to subtract costs in a specific sequence: product cost first, then fulfillment, then marketing spend, then operating expenses. Each layer produces a different profit metric (CM1, CM2, CM3, net profit), and each one answers a different question about your business. This article walks through every step with formulas, worked examples, and the benchmark ranges that tell you whether your numbers are healthy.
Key Takeaways
Shopify's dashboard shows revenue and gross profit, not net profit. The gap between the two can run 20 to 40+ percentage points once fulfillment, marketing, and operating costs are layered in.
The four profit layers are CM1 (gross profit after COGS), CM2 (after fulfillment), CM3 (after marketing spend), and net profit (after operating expenses). Missing any one of them gives you a number you can't act on.
Credit card processing fees alone run 2.5% to 2.9% plus $0.30 per online transaction on Shopify Payments (Shopify, 2026). Across thousands of orders, that's a material cost most mental models of profitability skip entirely.
The median DTC brand nets just 3 to 10% after all variable and fixed costs, according to Finaloop's dataset spanning $3.16B in aggregated brand revenue (Luca, 2026). Knowing your number beats guessing at an average.
Why Don't Shopify Reports Show Your Real Profit?
Shopify tracks sales exceptionally well. It wasn't built to track profit. That's not a criticism; it's just a design boundary that every merchant needs to work around. By default, your Shopify dashboard shows total sales, gross revenue, orders placed, average order value, and gross profit. Useful numbers, all of them. But incomplete for the question most founders are actually asking: what did I keep?
In our experience, the gap between what a store thinks it earns and what actually hits the bank account is one of the most common operational blind spots in DTC. Two stores with identical revenue can land at completely different profit margins. The calculation isn't optional. It's the only way to know which one you are.
What costs does Shopify leave out?
Shopify does not automatically calculate your product costs at the SKU level (custom COGS), actual shipping cost per order, the margin impact of your discount codes, what your refunds cost you beyond the revenue reversal, how your ad spend hits each individual order, or your operating overhead allocated per sale.
Strip those out and you often have something dramatically different from what the dashboard implies. A store generating $90,000 in monthly sales can have a net profit anywhere from $5,000 to $45,000 depending on how costs stack up. The only way to know is to run the full calculation.
How big is the gap between revenue and profit?
Bigger than most sellers expect. Across public DTC companies, median gross margin holds near 57% based on SEC 10-K filings (Eightx, 2026). But median operating margin for those same companies runs at negative 2.4%, meaning the product economics work fine and the business still loses money after everything else is paid (Eightx, 2026).
That's the gap this article helps you measure.
Step 1: What Is Gross Merchandise Value (GMV)?
GMV is the total value of all sales made through your Shopify store before any deductions. Think of it as the ceiling number. Almost every cost in the rest of this guide eats into it.
Formula: GMV = Sales Price x Units Sold
A store selling 1,000 units at a $90 average price has a GMV of $90,000. That number looks great on a dashboard. What it actually means for the business depends entirely on what comes next.
GMV is not profitable. It's not even revenue in the way most operators should use the term. It's the starting point, and every cost layer below pulls it down.
Step 2: How Do You Calculate Net Revenue on Shopify?
Net revenue is the portion of your sales that actually belongs to your business. Before you can calculate any profit metric, you need to know this number. Several deductions happen here that merchants regularly underestimate.
Remove taxes and line-item price cuts first
Formula: Gross Revenue = GMV - Taxes - Line-Item Price Cuts
Taxes pass through your account but aren't yours. They're collected on behalf of the government. Line-item price cuts are reductions applied at the product level before checkout. Both come out before any profit calculation is meaningful.
Then deduct discounts, refunds, and add shipping revenue
Formula: Net Revenue = Gross Revenue - Discounts - Returns and Refunds + Shipping Revenue Collected
This is where most merchants understate their real cost structure.
Discounts hurt more than they look. A 20% discount code on a $60 product doesn't just cost you $12. It costs $12 plus whatever you pay to fulfill, market, and operate behind that discounted order. The downstream cost of the discount compounds through every margin layer below.
Refunds carry two costs: the revenue reversal and the fulfillment cost you've already incurred. Both come out of margin. Tracking refund volume by product is one of the highest-value diagnostics available to any Shopify store.
Shipping revenue (what you charge customers for delivery) goes back in here. Many stores subsidize shipping at a loss. This step reveals by how much.
Net revenue is the baseline for every profit calculation that follows. All cost deductions from here on apply to net revenue, not GMV.
A quick note on taxes and duties: some merchants want these in their P&L for reporting purposes. They can be added as a separate Total Revenue line. But don't use Total Revenue as the basis for profit calculations. Net Revenue is the right denominator.
Step 3: How Do You Calculate Gross Profit (CM1) on Shopify?
CM1, or gross profit, is what's left after subtracting the cost of the products themselves. It's the first real test of whether your product economics work.
Formula: CM1 = Net Revenue - Product COGS
COGS (Cost of Goods Sold) includes everything it costs to get the product into inventory: manufacturing or wholesale cost, inbound freight, import duties, and quality inspection fees. If a cost exists because you have the product, it belongs in COGS.
A good gross margin for ecommerce typically lands between 50% and 70%, though the number varies by category and business model. Across 11 public DTC companies filing SEC 10-Ks, the median gross margin sits at 57%, with the 25th percentile at 46% and the 75th at 64% (Eightx, 2026). Private DTC brands should generally target 2 to 5 percentage points below the public benchmark for their category, since public companies have scale procurement and lower freight exposure.
What to watch:
A CM1 below 50% on a physical product is worth examining carefully. Heavy discounting paired with high COGS is a double compression hit on margin. And products with strong GMV but weak CM1 hide inside revenue reports undetected, draining profitability until you run this calculation at the SKU level.
Most Shopify merchants know their COGS in general terms. Far fewer track it accurately per variant. That gap is where margin leaks quietly.
Step 4: What Is Contribution Margin After Fulfillment (CM2)?
CM2 is what's left after you've paid to get the order to the customer. It's the most operationally honest profit metric for a Shopify store because it answers a clean question: if you had no ads and no fixed overhead, how much does each order actually contribute?
Formula: CM2 = CM1 - Fulfillment Costs
Fulfillment costs include outbound shipping cost per order, packaging and handling, return handling costs, payment processing fees, and any applicable tariffs.
Payment processing: the cost most merchants forget
Payment processing fees are the most commonly missed item in this layer. Shopify Payments charges 2.5% to 2.9% plus $0.30 per online transaction, depending on your plan level (Shopify, 2026). On a $90 order, that's roughly $2.31 to $2.91. Across a thousand orders per month, you're looking at $2,300 to $2,900 in processing fees alone. We've found that most merchants never include this number in their mental model of profitability, and it shows up as part of the unexplained gap between their dashboard and their bank account.
Return handling: tracked by rate, not by cost
The other common gap is return handling. Many stores track return rate but never calculate return cost. Industry benchmarks put the total cost to process a single ecommerce return at $15 to $30 or more, once you include inbound shipping, labor, restocking, and inventory write-downs (Redo, 2026). A Pitney Bowes survey of online retailers found the cost of processing a return averages 21% of the order's value (Signifyd, 2026).
At a 20% return rate (roughly the current ecommerce average per the NRF's 2025 Retail Returns data), a store doing 1,200 orders per month is processing about 240 returns. At even $15 per return, that's $3,600 monthly in return handling costs on top of the revenue reversal.
What CM2 tells you:
If CM2 is negative, the product costs more to make and deliver than the revenue it generates, before a single dollar of marketing has been spent. That's not a marketing problem. That's a product or pricing problem.
If CM2 is positive but thin, you have very little room to run paid acquisition. The ad spends math simply won't work.
Step 5: What Is Your Profit After Marketing Spend (CM3)?
CM3 is where the marketing spend reality check happens. It's what's left after every dollar spent on marketing.
Formula: CM3 = CM2 - Marketing Spend
Marketing spend includes every cost tied to acquiring customers, not just paid ads. That means all paid acquisition channels (Meta Ads, Google Ads, TikTok Ads, Pinterest, YouTube), plus influencer and affiliate payouts, agency or creative production fees, and email or SMS marketing tools. Ad spend is usually the largest piece, but it isn't the whole layer.
This is the layer where platform ROAS numbers become dangerous. Meta might report a 4x ROAS on a campaign. Google might report 3.5x on another. Add them together and you've apparently generated 3.7x your ad spend in revenue, except you haven't. Both platforms take partial credit for the same orders. The actual blended return is lower, often significantly.
The right question at CM3 isn't "what is my ROAS?" It's: "after paying for every product, every shipment, and every marketing dollar, how much is left per order?"
Worked example: two stores, same GMV, different profit
Take two stores, both at $90,000 GMV.
Store A spends $7,000 on marketing with lean fulfillment costs. CM3 lands at about $40,750, which is 59% of net revenue.
Store B has lower COGS giving it stronger CM1, but spends $10,000 on marketing and runs higher fulfillment costs. CM3 drops to $39,500, about 58% of net revenue.
Nearly identical CM3 percentages. Very different cost structures underneath. Which store is easier to scale? Store A. Its marketing spend is lower and fulfillment is tighter, giving more room to increase spend without compressing margins further. CM3 reveals the shape of the problem, not just the size.
Step 6: How Do You Calculate Net Profit on Shopify?
Net profit is what remains after every cost of running the business is accounted for. This is the number that should match (or explain the gap with) your bank account.
Formula: Net Profit = CM3 - Operating Expenses
Operating expenses include employee salaries and contractor fees, software subscriptions, warehouse or office rent, and professional service fees. Marketing costs don't belong here; they're already captured in CM3.
Operating expenses are where autopilot erodes profitability. Monthly SaaS subscriptions accumulate. Retainers renew. The $299 per month tool that was useful in Q1 is still billing in Q4. From what we've seen, most merchants can find $1,000 to $3,000 per month in operating expense reduction without removing anything critical, simply by auditing what's actually running.
Net Profit Margin = Net Profit / Net Revenue
A $37,150 net profit on $69,250 net revenue is a 53.6% net margin. A $32,500 net profit on $68,000 net revenue is 47.8%. Both look similar at the GMV level. The difference is cost discipline at every layer below the top line.
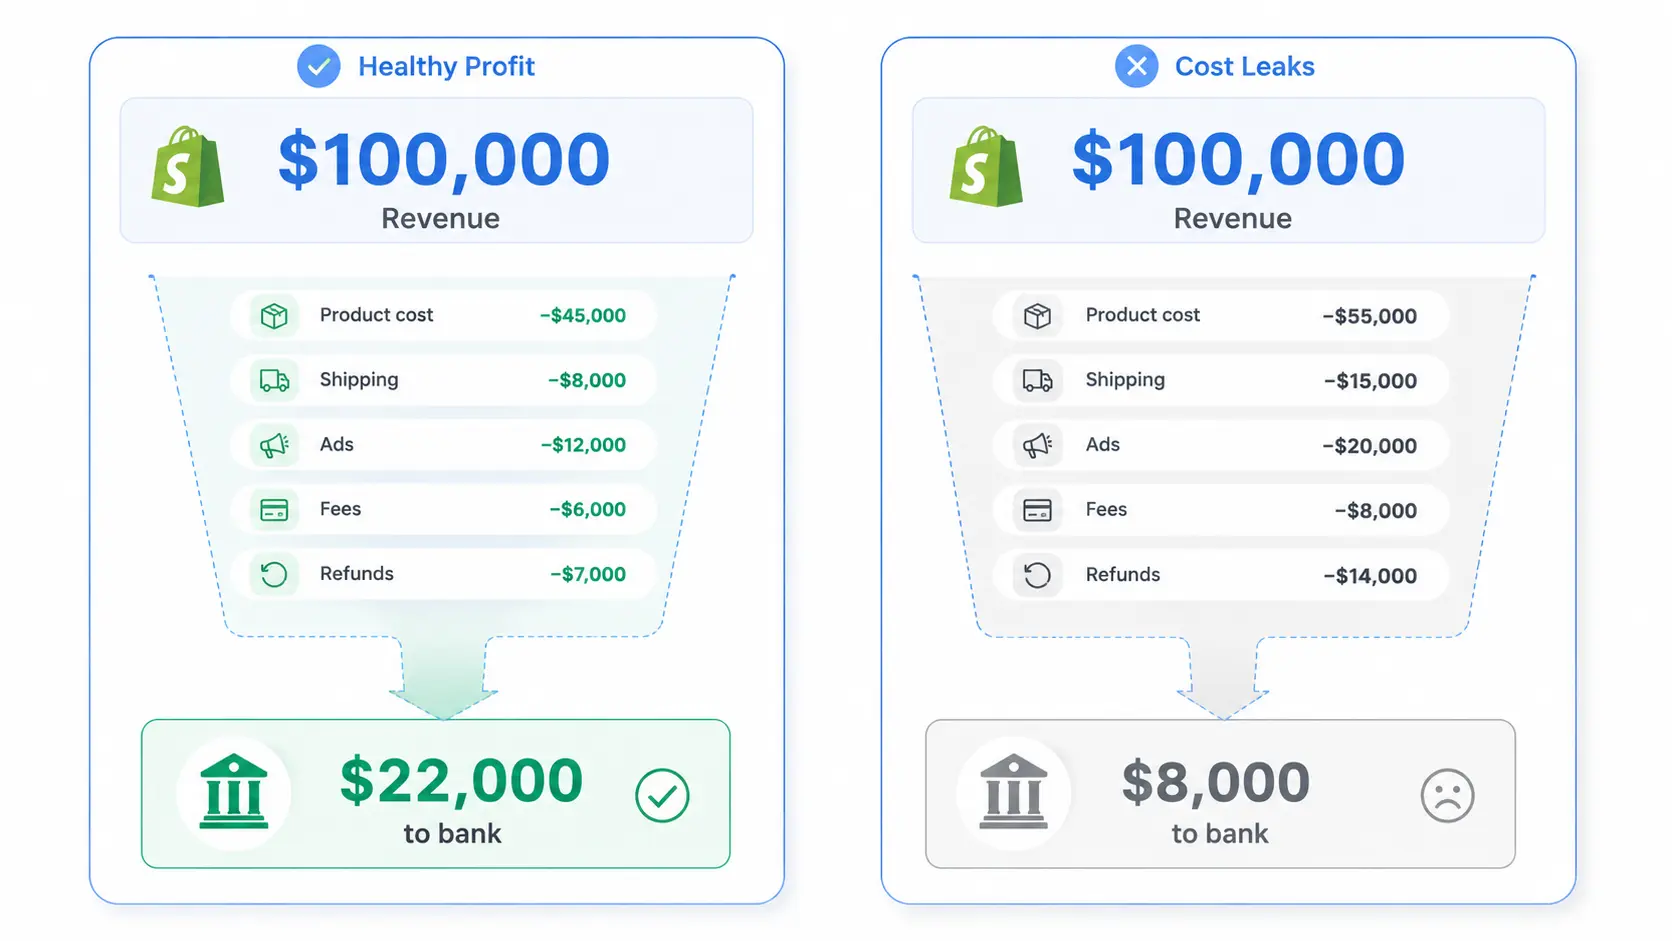
The full calculation, side by side
Here's how the complete profit funnel plays out across two stores with identical starting revenue. These are estimated figures to illustrate how costs stack. Your specific numbers will depend on your category, pricing, and operations.
Line Item | Store A | Store B |
GMV | $90,000 | $90,000 |
Taxes + Price Cuts | -$15,000 | -$18,000 |
Gross Revenue | $75,000 | $72,000 |
Discounts + Refunds + Shipping Rev | -$5,750 | -$4,000 |
Net Revenue | $69,250 | $68,000 |
Product COGS | -$19,000 | -$15,000 |
CM1 (Gross Profit) | $50,250 (73%) | $53,000 (78%) |
Fulfillment Expenses | -$2,500 | -$3,500 |
CM2 | $47,750 (69%) | $49,500 (73%) |
Marketing Spend | -$7,000 | -$10,000 |
CM3 | $40,750 (59%) | $39,500 (58%) |
Operating Expenses | -$3,600 | -$7,000 |
Net Profit | $37,150 (54%) | $32,500 (48%) |
Store B started with better product margins. But higher fulfillment costs, heavier marketing spend, and nearly double the operating expenses eroded that advantage entirely. Store A, with tighter cost discipline across fulfillment and operations, finished 6 margin points ahead.
This is the insight the Shopify dashboard can't give you. Revenue looked identical. Profitability was not.
What Do Good Profit Margins Look Like for Shopify Stores?
There's no single "good" margin because ecommerce economics vary widely by category, business model, and scale. That said, benchmarks help you diagnose whether you're in a healthy range or have a structural problem. The ranges below are estimates informed by industry data. Treat them as orientation, not hard rules.
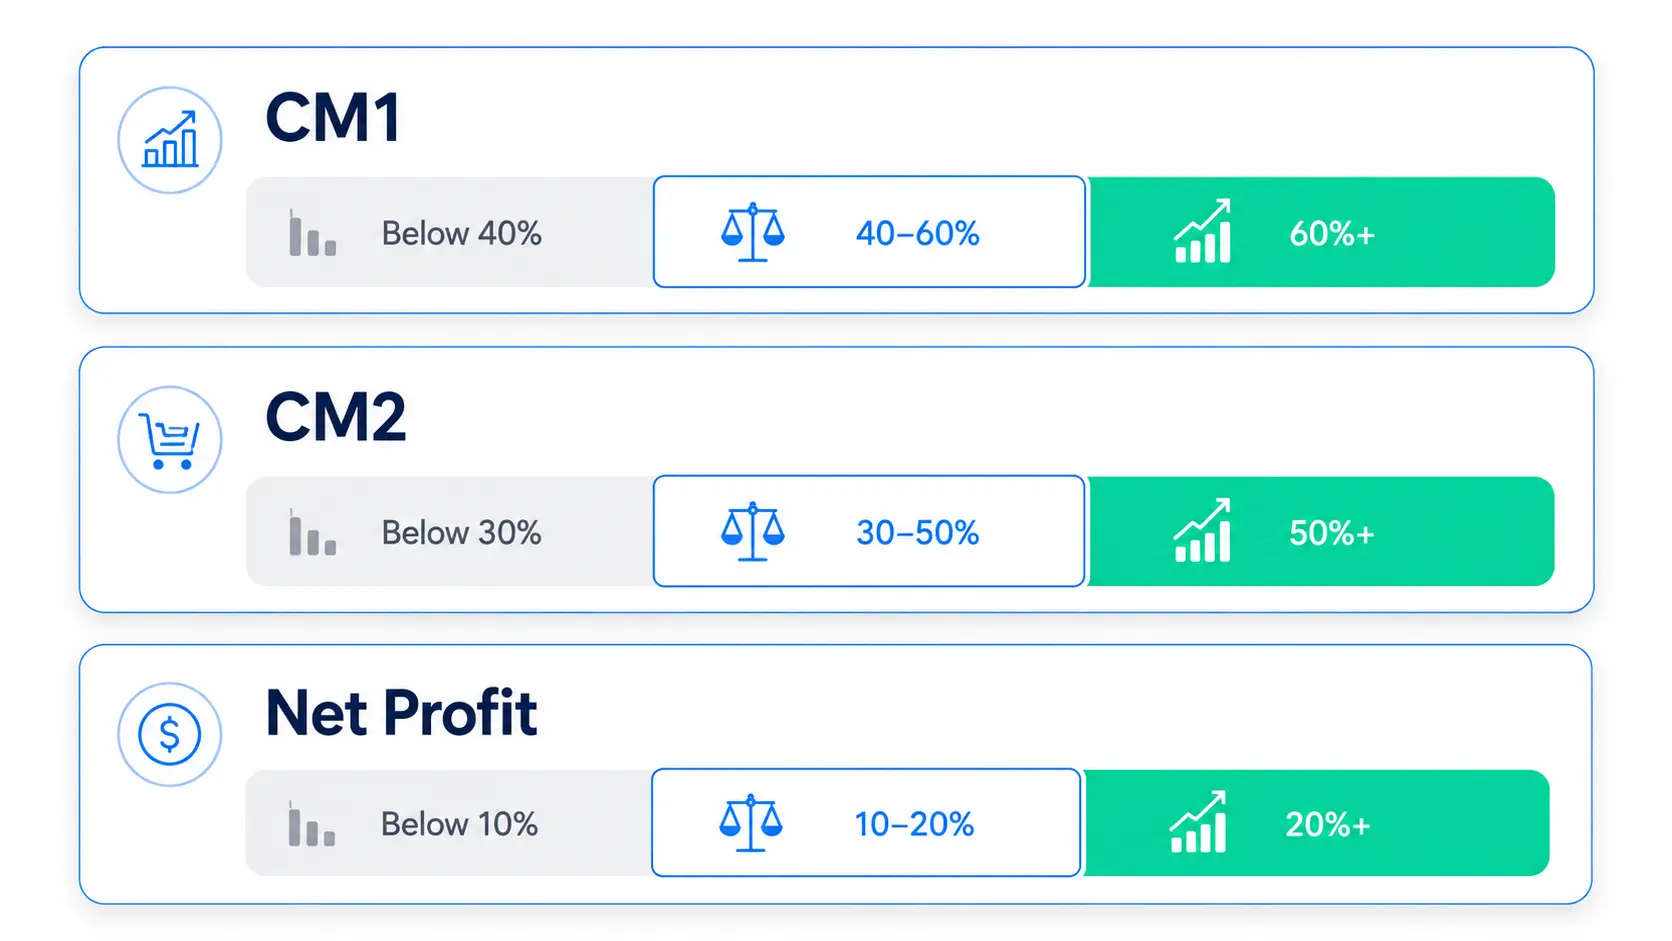
CM1 (Gross Profit Margin):
Below 40%: High COGS relative to price. Very limited room to run ads profitably. Worth examining whether the product or pricing needs adjustment.
40 to 60%: Workable. Most physical product categories land here. Median public DTC gross margin sits at 57% across SEC filings (Eightx, 2026), though private brands typically run a few points lower.
60%+: Strong product economics. More flexibility for acquisition spending and operational investment.
CM2 (After Fulfillment):
Below 30%: Thin. Scaling paid acquisition from here is difficult.
30 to 50%: Healthy range for most Shopify stores.
50%+: Lean operations. Good position to increase ad spend.
Net Profit Margin:
Below 10%: Vulnerable. One bad month, a COGS increase, or a tariff change causes real damage. The median DTC brand nets just 3 to 10% after all costs (Luca/Finaloop, 2026), so this range is more common than founders assume.
10 to 20%: Solid for a scaling DTC brand.
20%+: Excellent. Usually indicates strong product margins and disciplined operations.
A brand with high LTV and strong repeat purchase rates can operate at lower net margins profitably. Subscription models and categories with high repurchase rates (supplements, beauty, consumables) can afford thinner margins per order because the cohort payback math works over time. But the ranges above give you a starting point for diagnosing your own numbers.
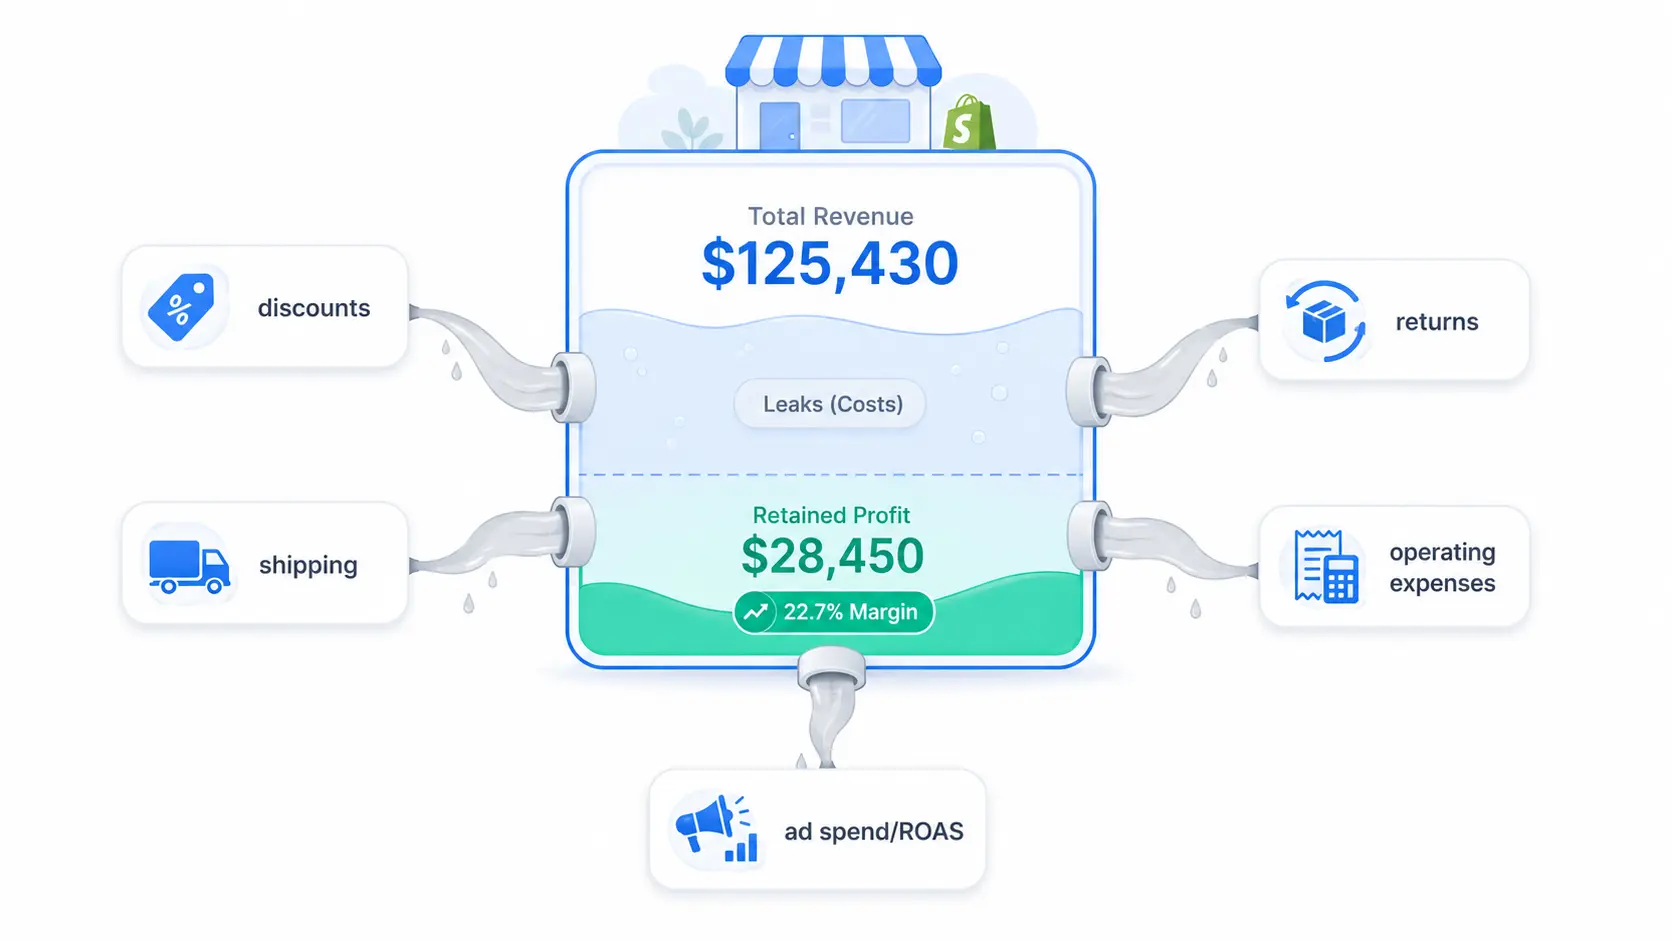
Where Do Shopify Merchants Lose Profit Without Realizing It?
Running this calculation once usually surfaces at least one surprise. These are the patterns we see most often.
Discounts applied without margin modeling. A 20% discount on a product with 45% CM1 takes that margin to 25% before fulfillment costs even apply. The math stops working fast. Most merchants run discount codes without checking CM1 at the discounted price. The fix is simple: before launching any promotion, calculate CM1 at the discounted price and confirm there's enough margin left to cover fulfillment and a reasonable share of ad spend.
Shipping costs are tracked as averages, not actuals. Estimated shipping rates are almost always lower than actual costs. Dimensional weight surcharges, fuel surcharges, and zone-based pricing mean the real cost per shipment typically runs higher than the rate card. If you use a 3PL, ask for per-order cost data. If yours doesn't provide it, that's worth a conversation.
Returns tracked by rate, not by cost. A 12% return rate sounds manageable. But the cost to process a single return runs $15 to $30 or more depending on your category and fulfillment model (Redo, 2026). Applied to 1,200 monthly orders, even the low end is $2,160 per month in return handling alone, before the revenue reversal.
Operating expenses set and forgotten. Agency retainers, software subscriptions, and tool licenses compound quietly. A quarterly audit of operating expenses typically reveals meaningful avoidable spend. One electronics DTC brand reportedly cut 5 unused tools, switched to a centralized ERP, and saved $650 per month plus 20+ hours of team time.
Platform ROAS accepted at face value. If your ad dashboard shows profitable ROAS but your CM3 tells a different story, the platform is probably claiming credit for organic and direct conversions. The CM3 calculation doesn't have that problem because it uses total ad spend divided by total attributed revenue, not platform-reported numbers.
How Do You See Profit Margin on Shopify?
This is one of the most searched questions in this space, and the answer has two parts.
What Shopify's native reports can show you
Inside your Shopify admin, go to Analytics, then Reports. The "Profit by product" and "Profit by product variant SKU" reports show gross profit based on the cost-per-item field you've entered for each product. If you've filled in your COGS at the variant level, these reports give you a basic view of gross margin.
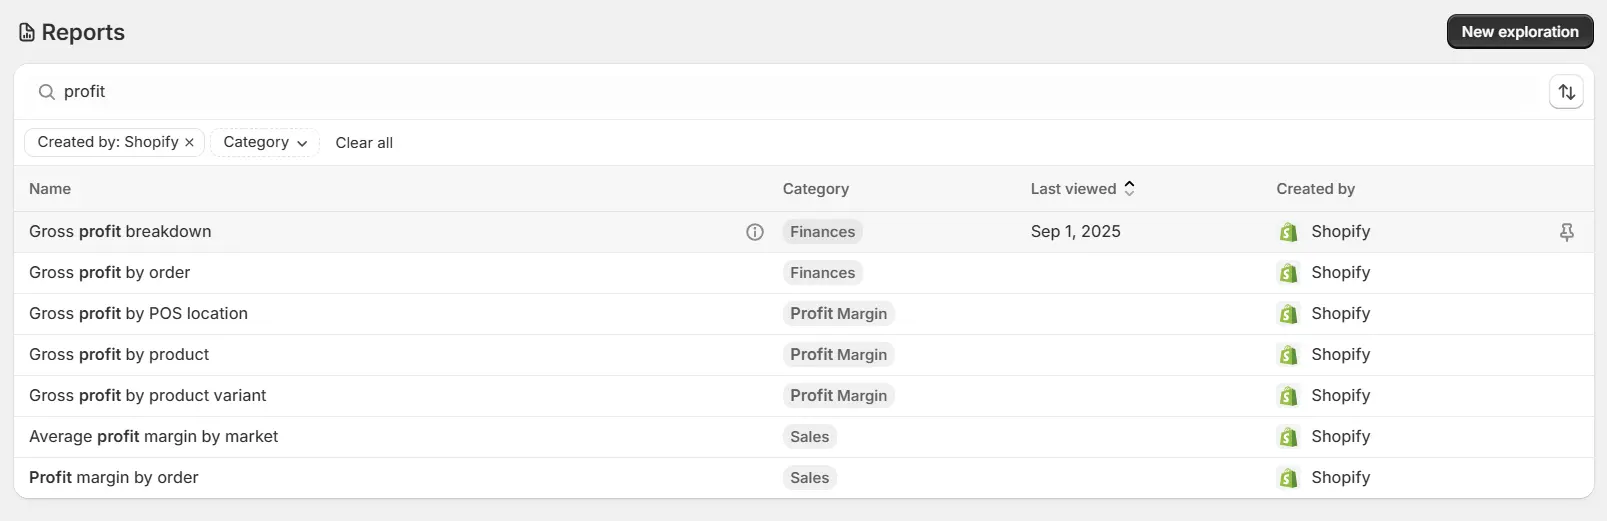
The limitation is that this is CM1 only, and only if your COGS data is accurate and complete. Shopify's native reports don't subtract fulfillment costs, payment processing fees, marketing spend, or operating expenses. They also don't attribute costs at the order level. So the profit number you see in Shopify is a starting point, not the final answer.
What you need beyond Shopify's built-in tools
To see your actual profit margin on Shopify, meaning CM1 through net profit, you need to either build and maintain a spreadsheet that pulls order data, COGS, shipping costs, marketing spend, and operating expenses together, or use a profit analytics tool that integrates these data sources automatically.
The spreadsheet approach works for a monthly snapshot. It's labor-intensive, breaks easily when data structures change, and doesn't update in real time. But it's free and gives you the full picture if you're rigorous.
Bloom automates this by pulling real COGS and order data from Shopify, integrating ad spend from Google, Meta, and TikTok, and showing CM1, CM2, CM3, and net profit updated daily. The War Room dashboard surfaces where margin is moving and which cost layer is responsible, so the diagnostic work that normally takes hours in a spreadsheet happens automatically.
How Do You Track Shopify Profit Ongoing, Not Just Once?
The one-time calculation above gives you a snapshot. Running a profitable store means tracking these numbers continuously, not just at month-end.
What you need for ongoing tracking:
Accurate COGS per SKU entered in Shopify. If this is missing, the entire calculation rests on estimates. Shopify allows COGS entry at the product variant level. It takes time to set up properly, but it's non-negotiable for accurate reporting.
Actual fulfillment costs per order, not averages. Most 3PLs provide per-order cost data. If yours doesn't, that's worth asking for directly.
Ad spend pulled at the campaign level, matched to the date range. The challenge is attribution overlap. Meta and Google both claim credit for the same orders. A blended approach, total ad spend divided by total orders for the period, gives a more honest picture than trusting any single platform's ROAS number.
A consistent review cadence. Weekly at minimum for ad spend and CM3. Monthly for the full P&L through to net profit. The tricky part is maintaining this cadence when things are going well. Profitable months are where cost creep starts. The discipline of weekly review catches it before it compounds.

Frequently Asked Questions
How do I find my net profit in Shopify?
Shopify's native reports don't calculate net profit. To find it, start from net revenue and subtract product COGS, fulfillment expenses, marketing spend, and operating expenses in sequence. You can do this manually using Shopify's export data in a spreadsheet, or automatically with a profit analytics app that integrates COGS and ad spend data.
What is a good profit margin for a Shopify store?
It depends on category and business model. Gross profit margin (CM1) typically runs 40 to 60% for physical product stores. The median across public DTC companies is 57% (Eightx, 2026). A net profit margin of 10 to 20% is solid for a scaling DTC brand. Below 10% net margin, a store is vulnerable to any meaningful cost increase or demand dip.
Why does my Shopify revenue not match my bank balance?
Because revenue and profit are different numbers. Revenue is what customers pay. Profit is what remains after COGS, shipping, payment processing fees, marketing spend, refunds, and operating costs. A store with strong revenue and poor cost control will always see a gap between its dashboard and its bank account. That gap is exactly what the CM1-through-net-profit calculation in this guide measures.
Does Shopify calculate COGS automatically?
Shopify allows you to enter COGS at the product variant level, but it doesn't calculate full profitability automatically. You input the cost data, and Shopify's reports use it in limited gross profit views. For a profit calculation that includes fulfillment, marketing spend, and operating expenses, you'll either need a spreadsheet or a dedicated analytics tool.
What is the difference between gross profit and net profit on Shopify?
Gross profit (CM1) is revenue minus product cost only. Net profit is what remains after every cost, including fulfillment, marketing spend, and operating expenses, has been subtracted. Gross profit tells you whether your product pricing works. Net profit tells you whether your business works. A product can have strong gross profit and still lose money once every other cost is accounted for.
How does ad spend affect Shopify profitability?
Ad spend comes out of margin after product cost and fulfillment (CM2). If your CM2 is 35% and ad spend runs at 25% of revenue, your CM3 is 10%. That leaves almost no room for operating expenses before profit disappears. The right way to evaluate ad spend is by its impact on CM3, not by platform ROAS alone.
What costs do most Shopify merchants miss in their profit calculations?
The most commonly missed costs are payment processing fees (2.5 to 2.9% plus $0.30 per transaction on Shopify Payments), return handling costs beyond the revenue reversal ($15 to $30 per return), dimensional weight surcharges in shipping, and operating expenses that accumulate through automatic renewals. Each seems small individually. Together, they regularly account for 5 to 10 percentage points of margin that merchants assume they have but don't.
How often should I calculate profit on my Shopify store?
Weekly at minimum for ad spend and CM3. Monthly for the full P&L through to net profit. The discipline matters most when things are going well, because profitable months are where cost creep starts. A consistent cadence catches margin erosion before it compounds into a quarterly surprise.
What to Do Next
Running this calculation manually once is a good starting point. Building it into how you review your business every week is what separates operators who know their numbers from founders who are surprised by them.
If you want to see this profit funnel applied to your actual Shopify data without building and maintaining a spreadsheet, Bloom has a free trial. It installs on Shopify in a few minutes, connects your COGS and ad spend, and shows your full profit picture updated daily.
If you'd rather have someone walk through your specific numbers first, the consultation demo call is free.
Know Your Real Profit And
The Ads That Actually Sell.
No need to spend. Just try it on your store.


