If you sell across multiple channels, you've probably asked yourself questions your dashboards can't answer. Which channels bring my most profitable customers? Which channels are actually driving profit after all costs? Which channels should receive more budget? Which channels are becoming more expensive to scale?
Many merchants equate ecommerce profitability by channel with the revenue each channel generates. In reality, two channels generating similar revenue can deliver very different profits because of their channel-specific costs.
This article covers the two main areas of ecommerce channel profitability: sales channels, where transactions take place, and marketing channels, which acquire those customers. We'll explore the metrics that matter and how to measure profitability for each so you can confidently identify which channels to scale, optimize, or reduce investment in.
TL;DR
A profitable ecommerce business starts with knowing which channels are actually making money, not just generating sales.
The two main ways to evaluate ecommerce profitability is to analyze your sales and marketing channels.
The goal isn't to scale every channel. It's to grow through the ones where the margin holds.
What Does Ecommerce Profitability by Channel Actually Measure?
Ecommerce profitability by channel measures how much profit each channel contributes after accounting for the costs associated with generating and fulfilling its sales. The way you measure profitability depends on whether you're evaluating a sales channel or a marketing channel, as each answers a different business question.
Sales Channels
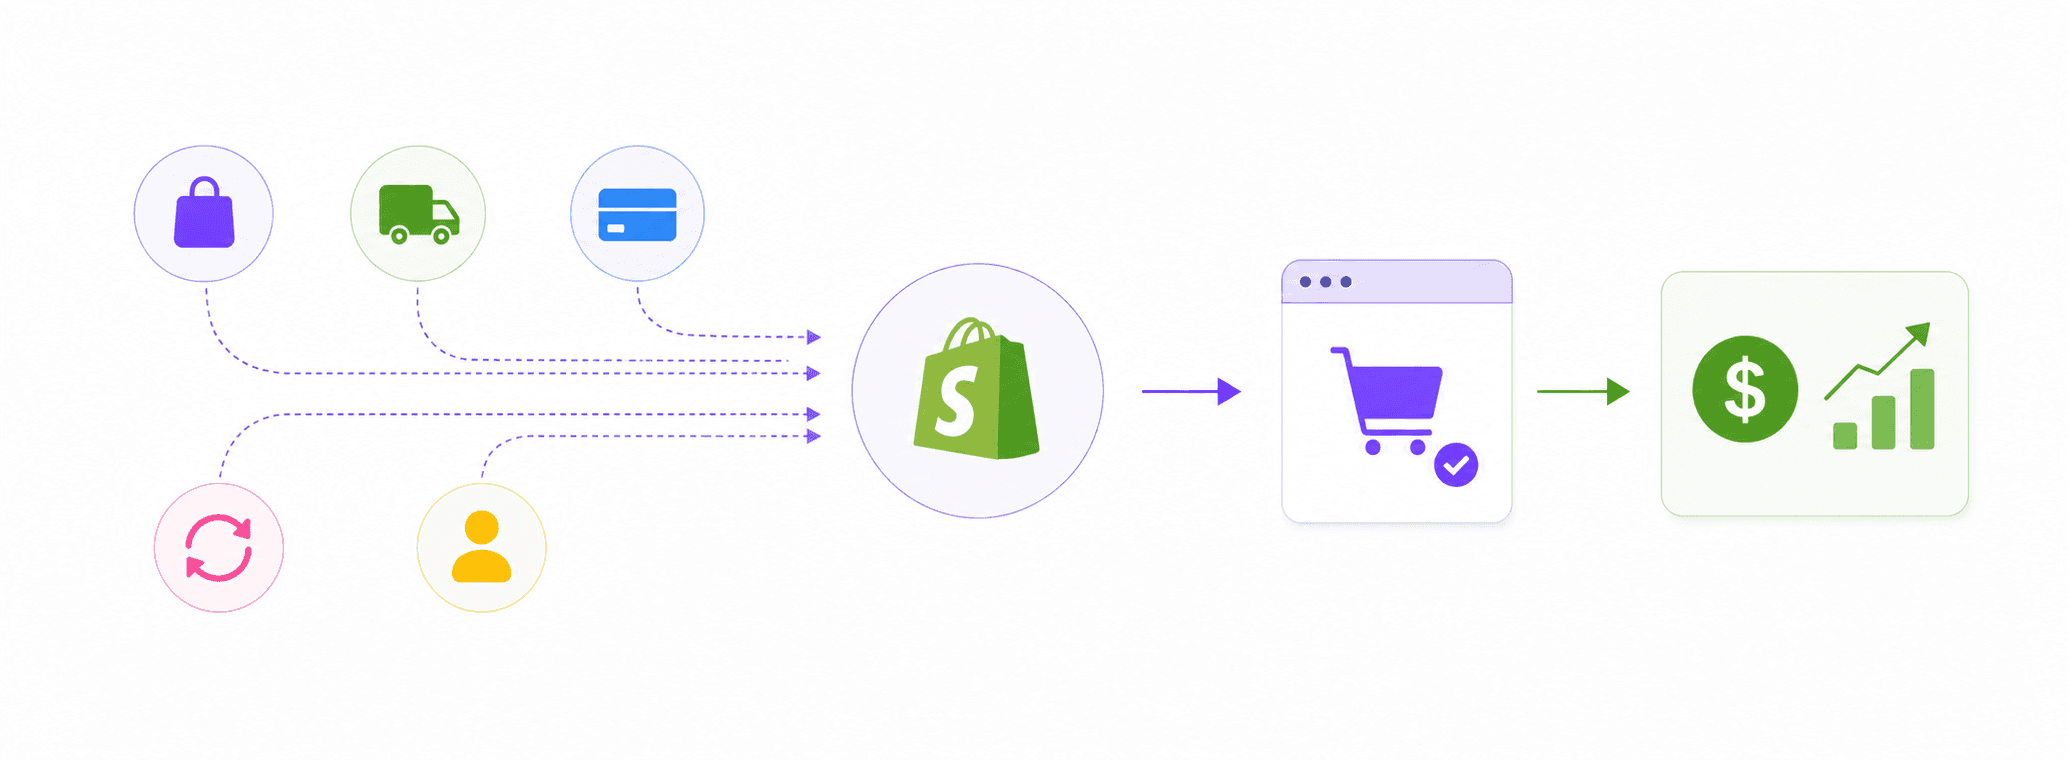
Your Shopify store is a sales channel. Every order placed there carries a set of operational costs: what the product cost to make or buy, what it cost to ship and fulfil, what the payment processor charged, what came back through refunds and discounts, and what it cost to acquire the customer. Measuring sales channel profitability accounts for these costs so you can see how much profit the store actually generates and where profitability is being eroded.
Marketing Channels
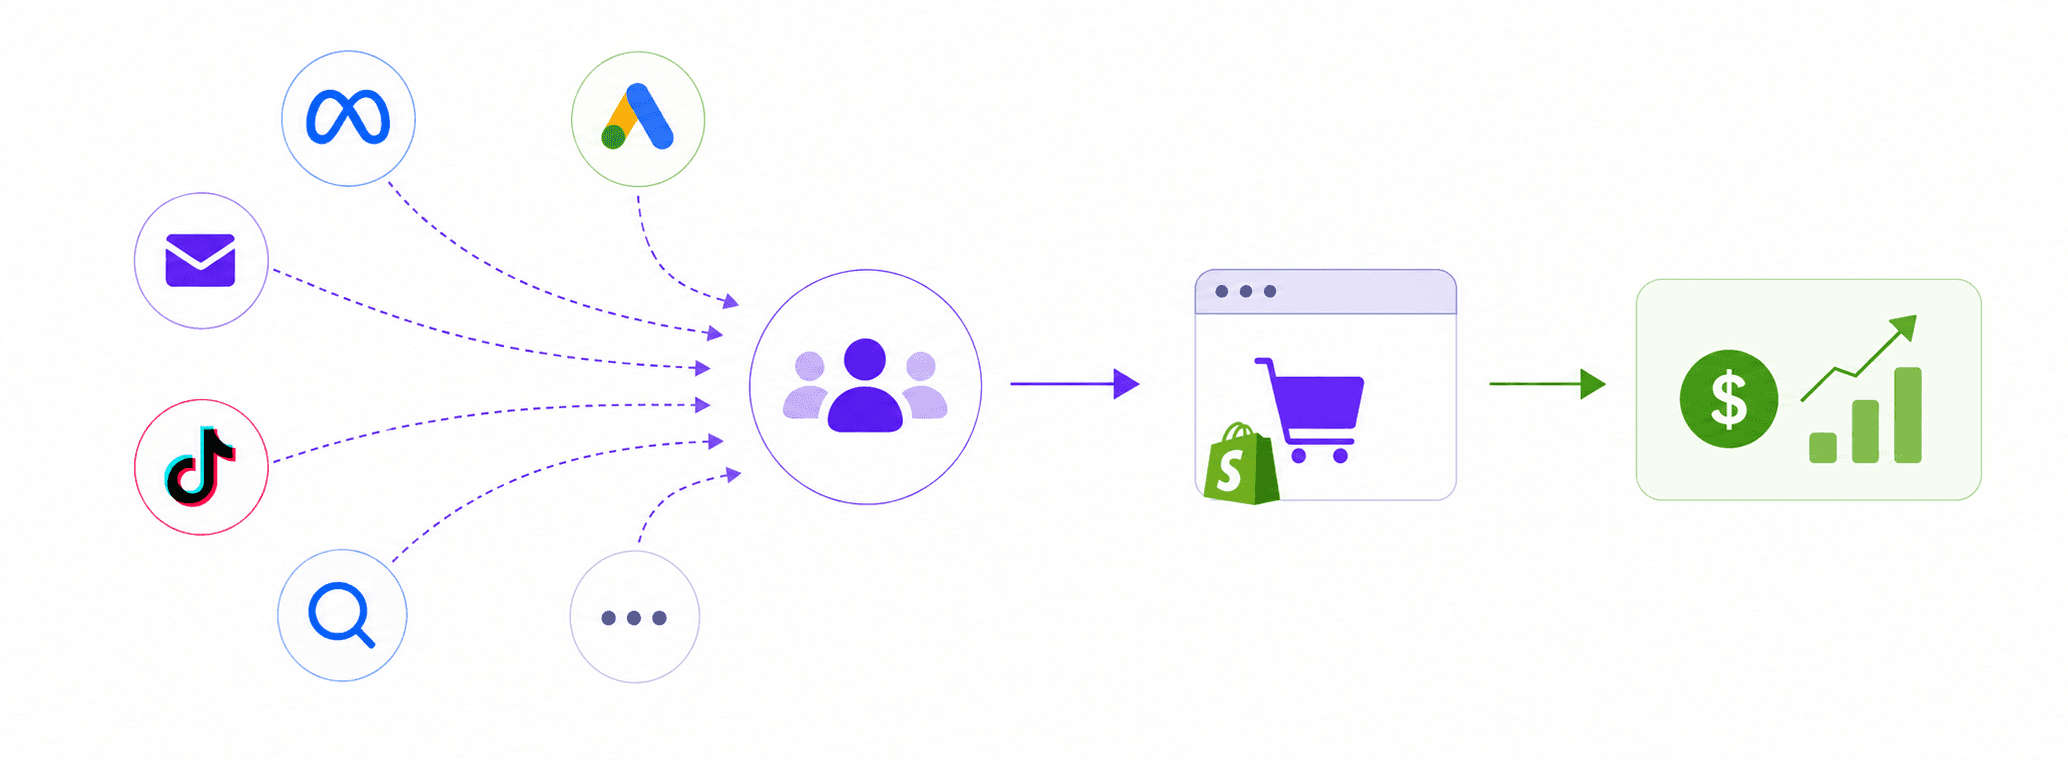
Marketing channels are how customers discover your business before making a purchase. These include Meta Ads, Google Ads, Email, Organic Search, TikTok, and other acquisition channels. Measuring marketing channel profitability means evaluating whether the customers acquired through each channel generate enough profit to justify the cost of acquiring them.
A single order carries both a set of operational costs from the sales channel and an acquisition cost from the marketing channel. Until you account for both, you don't have the full picture of what that order was worth.
Why You Need to Track Profitability by Channel

Tracking profitability at the channel level gives you a clearer picture of which channels actually contribute to your bottom line. This allows you to allocate budgets more effectively, identify where marketing spend generates the strongest returns, uncover cost inefficiencies before they erode margins, and better understand how different channels perform.
For instance, two marketing channels can report similar ROAS while delivering very different profit. If one channel consistently acquires customers who buy lower-margin products, generate higher return rates, or never purchase again, the contribution margin on those sales will be significantly lower despite comparable top-line numbers. The same logic applies to campaigns. A Meta campaign and a Google campaign can look equally efficient on paper, but once you account for product cost, fulfilment, and payment processing on the orders each channel drove, one may be contributing meaningfully to profit while the other is spending it.
This is why tracking channel profitability matters. The following sections explain how to measure it for sales channels and marketing channels, and which metrics matter for each.
How to Measure Sales Channel Profitability
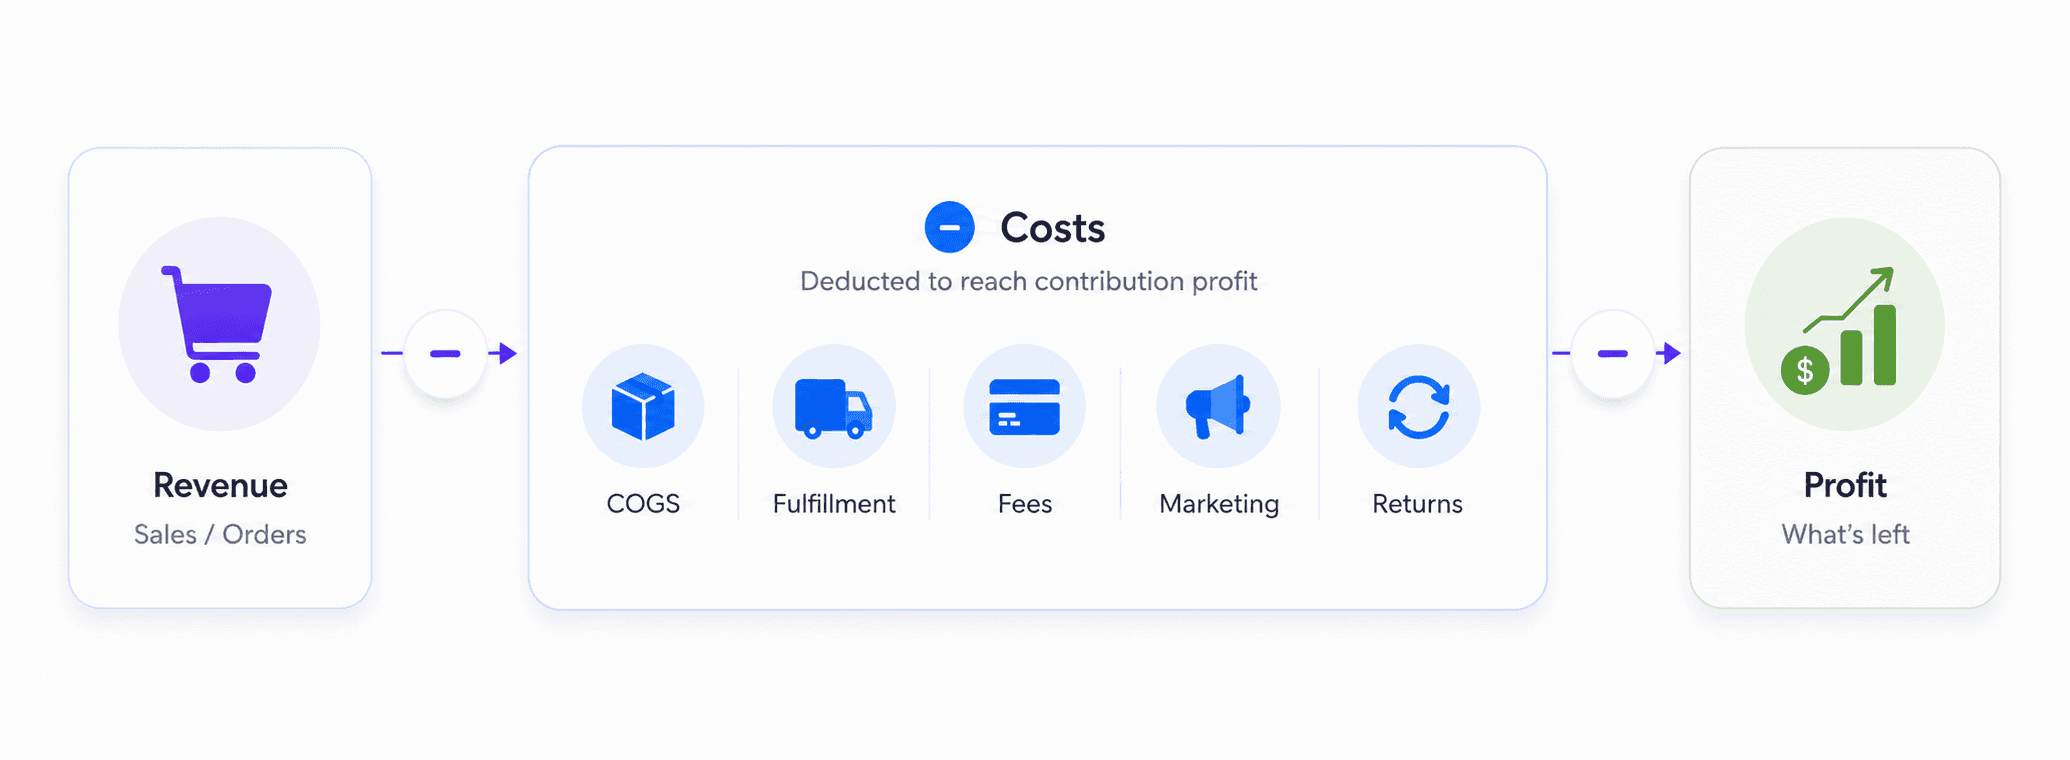
Sales channel profitability follows the money through every stage of an order, from the moment a customer checks out to the point where the business knows how much profit it actually kept. Instead of looking at revenue or gross profit in isolation, you progressively deduct the costs associated with selling, fulfilling, marketing, and operating the business.
The contribution margin framework makes this easier to see.
Let's take a simple example: a customer places a $120 order through your Shopify store.
Calculation | Amount |
Gross Revenue | $120.00 |
Discounts | -$10.00 |
Returns & Refunds | -$5.00 |
Shipping Revenue | +$8.00 |
Net Revenue (Gross Revenue − Discounts − Returns & Refunds + Shipping Revenue) | $113.00 |
Taxes | +$12.00 |
Duties & Tips | $0.00 |
Total Revenue (Net Revenue + Taxes + Duties & Tips) | $125.00 |
COGS | -$42.00 |
Gross Profit (CM1) (Total Revenue − product cost) | $83.00 (66.4%) |
Order Fulfillment Costs | -$11.00 |
Profit after Fulfillment Cost (CM2) (CM1 − Order Fulfillment Costs) | $72.00 (57.6%) |
Marketing Spend | -$24.00 |
Profit after Marketing Spend (CM3) (CM2 − Marketing Spend) | $48.00 (38.4%) |
Operating Expenses | -$20.00 |
Disputes | -$2.00 |
Net Profit (CM3 − Operating Expenses − Disputes) | $26.00 (20.8%) |
Illustrative example only.
Here's what this calculation is showing you.
A $120 order might look like a profitable sale at first glance, but the revenue from that order is only one part of the picture. A Shopify sale comes with a range of costs that affect how much money the business actually keeps.
Some costs reduce the revenue generated by the sale, such as discounts and refunds, while shipping revenue, taxes, and duties also form part of the money collected from the customer. Then there is the cost of the product itself, followed by the costs of getting the order to the customer, including shipping and fulfillment. The business may also incur marketing costs to acquire the customer in the first place.
Once these costs are accounted for, the example shows that the original $120 sale ultimately contributes $26 in net profit, or a 20.8% net profit margin.
The point isn't just to arrive at a final profit number. The different levels of the calculation show where the money from a sale is going. CM1 shows what remains after the product cost. CM2 shows what remains after the costs of fulfilling the order. CM3 shows what remains after marketing spend. Net profit shows what the business ultimately keeps after operating expenses and other overhead.
This is what makes a sales channel profitability view more useful than looking at sales alone. Revenue tells you how much your Shopify store sells, but accounting for the costs associated with those sales tells you how much profit the sales channel actually generates. It also helps you see where that profit is being eroded, whether by product costs, fulfillment, marketing, or operating expenses.
How to Measure Marketing Channel Profitability
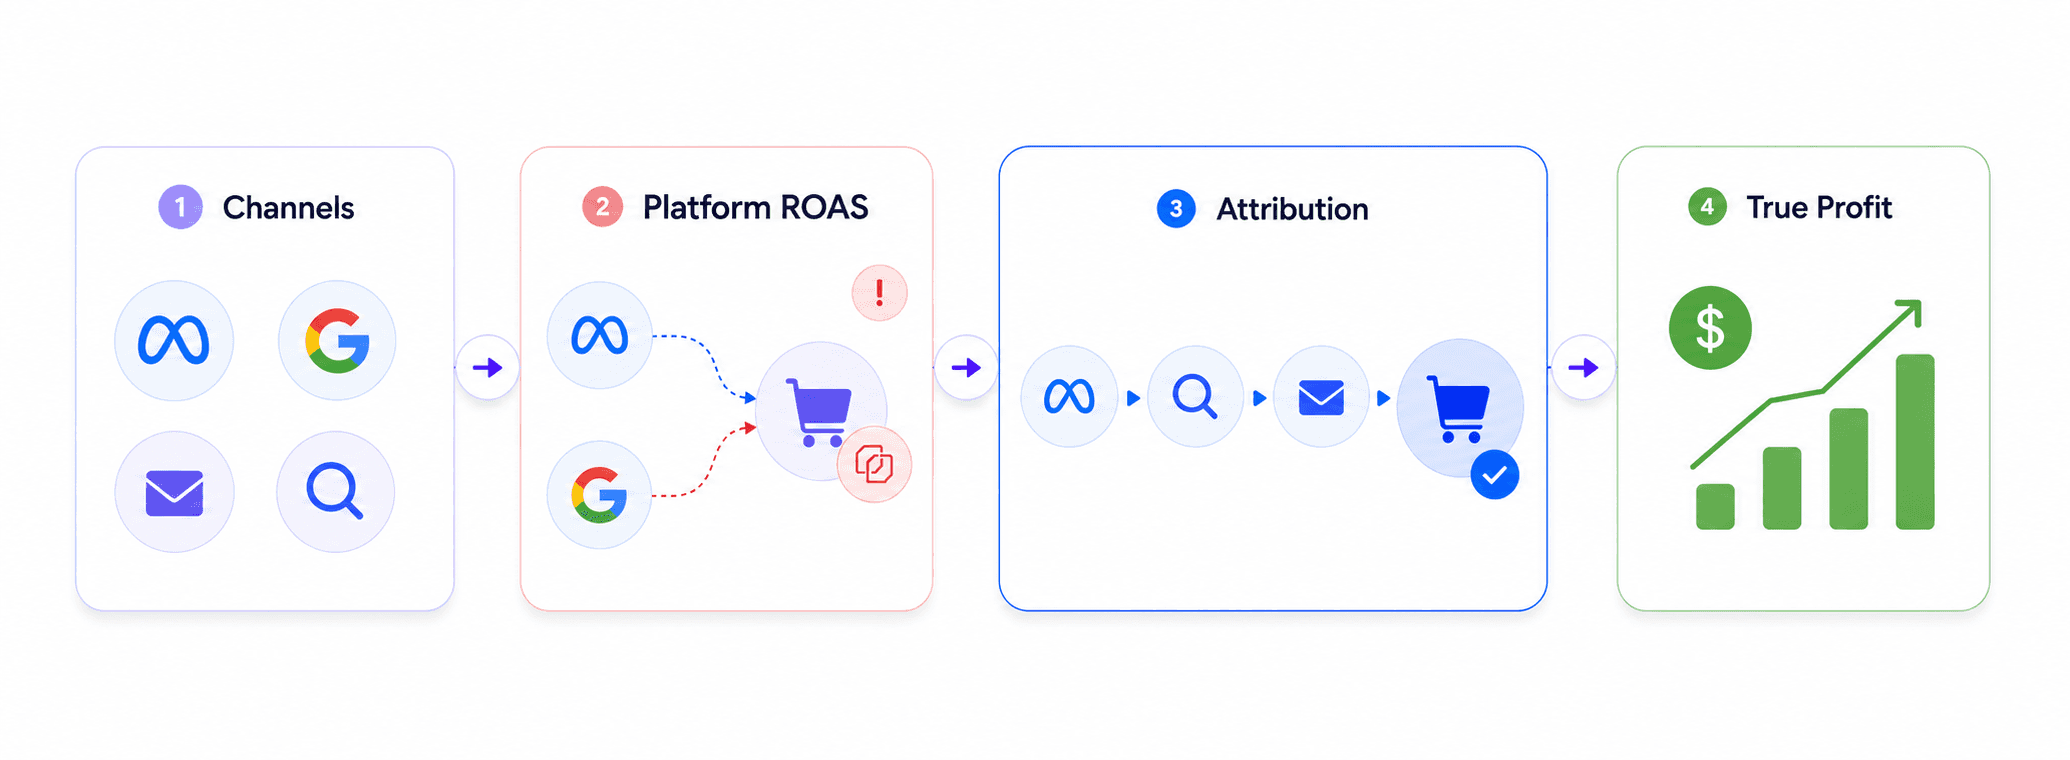
The profitability question for a marketing channel isn't how much revenue it generated. It's how much profit the customers it acquired actually produced.
Every order your Shopify store receives came from somewhere. A customer clicked a Meta ad. They found you through a Google search. They opened an email. Understanding which channel should receive credit for that order is the attribution question, and it matters because platforms don't agree on the answer.
Each ad platform reports conversions based on its own tracking window and attribution model. A customer who sees a Meta ad on Monday, clicks a Google Shopping result on Wednesday, and purchases on Thursday may be counted as a full conversion by Meta and as a full conversion by Google simultaneously. The actual revenue from one order gets attributed to two channels. If you set budgets based on each platform's reported ROAS, you're working from inflated numbers on both sides.
Attribution solves this by establishing which channel should receive credit for each order based on the customer's actual journey, rather than each platform's self-reported version of it. Once orders are correctly attributed, you can calculate the real cost of acquiring customers through each channel and compare that against the profit those orders generated.
Take the same $120 order from the sales channel example. Before marketing spend is considered, that order has a CM2 of $72. Now suppose three identical orders came from three different marketing channels, each with a different cost to acquire the customer.
Marketing Channel | CM2 (Before Marketing Spend) | Customer Acquisition Cost | CM3 (After Marketing Spend) |
Meta Ads | $72.00 | $24.00 | $48.00 |
Google Ads | $72.00 | $16.00 | $56.00 |
$72.00 | $4.00 | $68.00 |
Illustrative example only.
Same product. Same operational costs. Very different profit per order. Looking at revenue alone, all three channels appear equally productive because each generated a $120 sale. But CM3 shows what remains after the cost of acquiring the customer. Email leaves $68 in contribution, while Meta leaves $48, meaning the email channel contributes $20 more profit per order because its acquisition cost is lower.
This pattern tends to hold at scale. When you aggregate all orders attributed to each channel over a month, the channel that drives the most revenue is often not the channel that drives the most profit. A channel can drive significant sales but require high acquisition costs, while another may generate less revenue but leave more profit behind because its customers cost less to acquire.
That is the decision-making view channel-level profitability gives you. Not which channel is busiest, but which channel is actually building margin, and which one is spending it faster than it's earning it.
Conclusion
Selling across multiple channels creates more opportunities to grow, but it also makes profitability harder to track. Revenue, selling costs, fulfillment expenses, and marketing spend are often spread across different platforms, making it difficult to see which channels are making you money.
That's why sales and marketing channels need to be evaluated separately, using the costs that matter to each. This makes it easier to identify your most profitable channels and uncover where costs are weighing on your bottom line.
Doing this manually, however, means constantly pulling data from Shopify, ad platforms, and fulfillment systems and keeping everything up to date as costs change, refunds come in, and attribution shifts.
For merchants looking to simplify this process, Bloom brings together the data needed to understand profitability across sales and marketing channels. It takes care of the complex calculations behind channel profitability, so you can spend less time piecing together reports and more time understanding which channels are driving profitable growth.

Frequently Asked Questions
What is ecommerce profitability by channel? Ecommerce profitability by channel measures how much profit each sales or marketing channel generates after the costs associated with that channel are applied. For a sales channel like Shopify, that means deducting COGS, fulfilment, payment processing, discounts, and returns. For a marketing channel like Meta, it means deducting the acquisition cost from the profit on orders that channel generated.
Why can't I just use ROAS to compare my marketing channels? ROAS measures attributed revenue divided by ad spend. It doesn't account for product costs, fulfilment, or payment processing on those orders, and platform attribution often double-counts conversions across channels. A 4x ROAS on a low-margin product can still represent an unprofitable campaign. Contribution margin after ad spend (CM3) is the more reliable metric for comparing channels on profitability.
What is the difference between CM1, CM2, and CM3? CM1 is gross profit after deducting COGS from net revenue. CM2 is profit after also deducting fulfilment costs including shipping, handling, payment processing, and duties. CM3 is profit after also deducting the advertising spend attributed to those orders. Each tier strips away another layer of cost so you can see exactly where margin is being created or lost.
How do I know which marketing channel to attribute an order to? Attribution models connect orders to the channels that influenced them using signals like ad clicks, view-throughs, and tracking pixels. Different models (last click, first click, linear, data-driven) assign credit differently, and most platform dashboards use their own attribution window. For a consistent view across channels, a third-party attribution tool or a profit analytics app that normalises attribution across platforms produces more reliable results than reading each platform's own dashboard in isolation.
Is it worth tracking profitability separately for each marketing channel? Yes, because acquisition cost varies significantly between channels and that variation directly affects how much profit each channel generates. From what we've seen, email and organic search consistently produce higher CM3 than paid channels because the incremental cost of acquiring a customer through those channels is lower. Without channel-level profitability data, it's easy to scale expensive acquisition channels while underinvesting in the ones that actually build margin.
Discover More