Shopify Email Analytics: How to Measure Your Actual Profitability
Shopify email marketing revenue hides what you actually keep. Learn how to measure real profit per campaign and flow using COGS, discounts, and refunds.

Most Shopify Email Analytics dashboards lead with attributed revenue, and it is the number founders quote in weekly reviews. The problem is that revenue is the top of the funnel, not the bottom. A $10,000 email campaign built on 40% off site-wide, promoting your lowest-margin SKUs, with a 12% refund rate, can leave you with a few hundred dollars of gross profit or less.
Klaviyo, Shopify Email, and Omnisend all report attributed revenue and orders. None of them know your unit economics. That gap is where most email programs quietly lose money.
This guide explains the key factors that determine profitability, why campaign margins may be low, and how to use email data to make more informed and effective decisions.
Key Takeaways
Shopify email Analytics dashboards report revenue, not profit, so a $10,000 campaign can quietly lose money after COGS, discounts, and refunds.
Gross profit and margin per campaign and flow are the metrics that show what your email program actually contributes to the business.
Breaking profit down by cost driver (product cost, discount depth, refund rate) shows why a campaign underperforms, not just that it did.
Bloom connects every email-attributed order to its financial data and labels each campaign and flow as a Profit Engine, Solid Earner, Margin Trap, Breakeven Zone, or Money Pit.
What actually determines email profitability?
Four numbers turn attributed revenue into gross profit:
COGS on the products sold. A campaign that pushes a 22% margin bundle earns very differently from one that pushes a 68% margin accessory, even at the same revenue.
Discount codes and automatic discounts applied at checkout. A 25% welcome-flow code eats directly out of margin, not out of a marketing budget line.
Refunds and returns tied back to the campaign. Post-purchase and win-back flows often carry higher return rates because they push repeat conversions on borderline-fit shoppers.
Transaction and shipping costs allocated to the order. These are small per order and large across a campaign.
Gross profit is revenue minus these. Margin is gross profit divided by revenue. Both numbers need to sit next to attributed revenue in every campaign and flow report, otherwise you are optimizing for the wrong thing.
Why is a campaign's margin low?
Two campaigns have 8% margin for very different reasons, and the fix is different for each.
High COGS on the featured SKUs. The campaign is doing its job, but you are promoting products that never had room to give. Fix: switch the featured products, not the email.
Discount depth. The offer converted, but you paid for the conversion out of margin. Fix: test a smaller discount, a threshold-based offer, or a bundle instead of a flat percentage.
Refund rate. The campaign converted a segment that returned more than average. Fix: tighten the audience or the product selection.
Product mix skew. A single low-margin SKU accounted for most of the units. Fix: cap or exclude that SKU from the audience next time.
Without a per-campaign profit breakdown, all four look identical in the report. With one, the diagnosis takes a minute.
How does Bloom show profit per campaign and flow?
Bloom pulls Shopify order data, product costs, order fulfillment, discounts, and refunds, then joins every email-attributed order back to the campaign or flow that drove it. For each one you see:
Attributed revenue
COGS on the units sold
Discount value applied
Gross profit
Profit margin
That set sits in a single view, sortable, so a weekly review compares Black Friday against a Tuesday newsletter on the same terms.
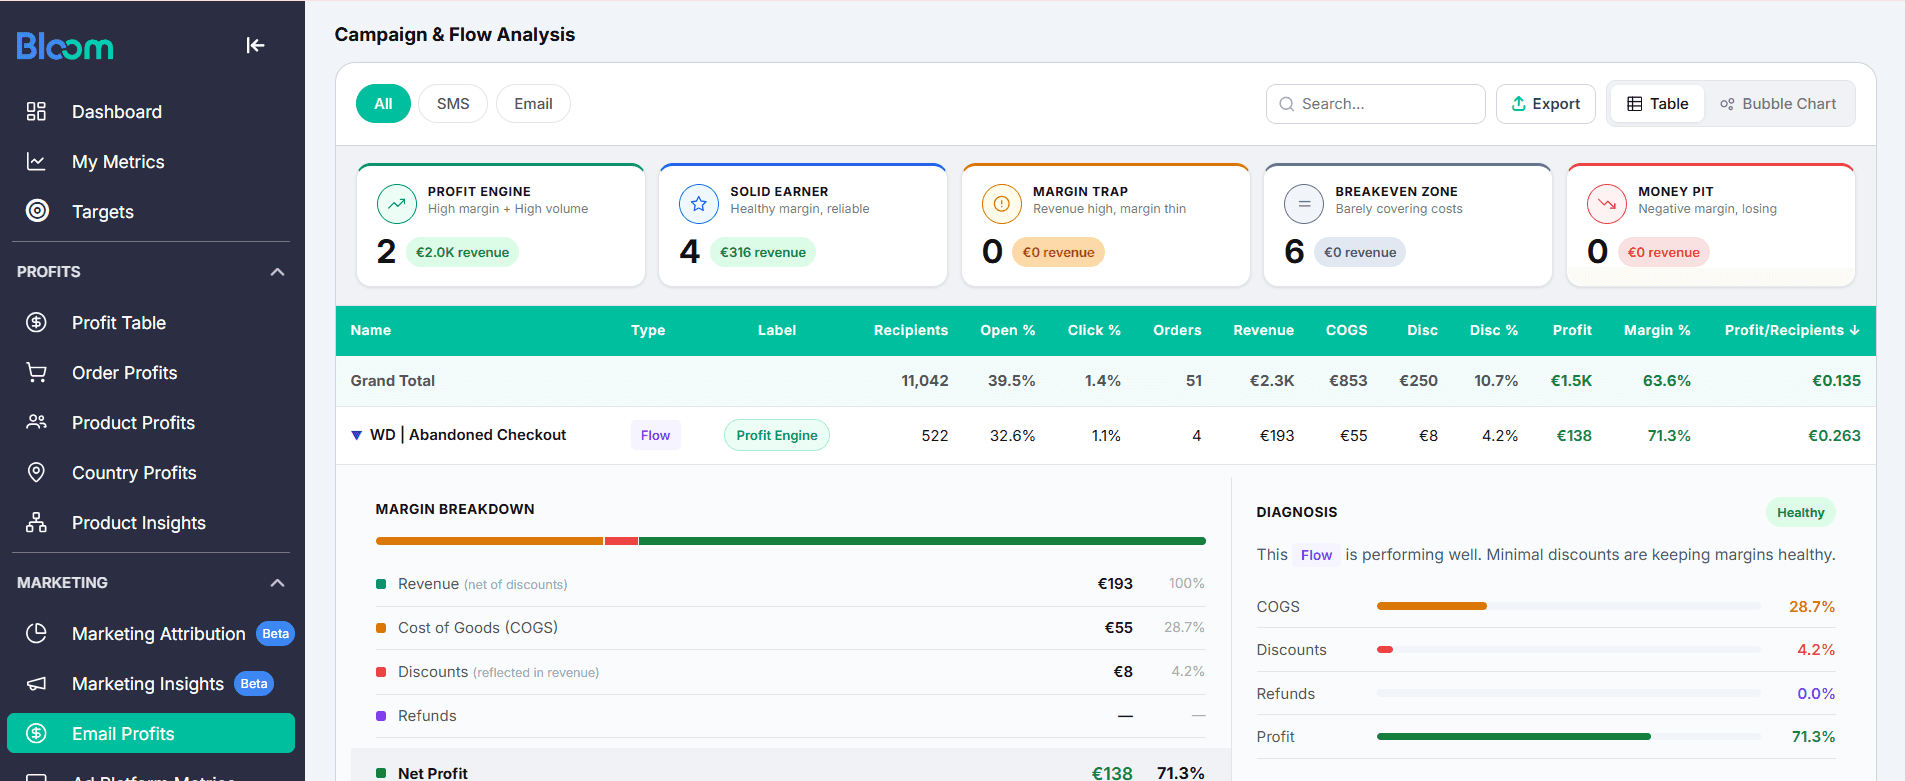
To make triage faster, Bloom labels each campaign and flow:
Profit Engine. High revenue and healthy margin. Repeat and scale.
Solid Earner. Consistent profit contribution, worth keeping in rotation.
Margin Trap. Strong revenue, thin margin. Usually a discount or product-mix problem.
Breakeven Zone. Roughly zero profit contribution. Rework or retire.
Money Pit. Net negative after costs. Pause and diagnose before running again.
The labels are shortcuts for the numbers, not a replacement for them. Every label opens into the underlying breakdown.

How do you turn email data into decisions?
The workflow shifts once profit sits next to revenue:
Sort flows by gross profit, not revenue. The welcome series usually stays on top. The winback flow often drops several places once refunds are counted.
Compare campaign types on margin. Full-price product launches typically post higher margins than seasonal sales, even when the sale posts higher revenue. Knowing the gap by how much informs the next quarter’s calendar.
Retire Money Pit campaigns. A campaign that consistently lands negative is not a "brand play." It is a subsidy to the segment that opened it.
Reframe the weekly question. Not "which email made the most revenue," but "which email made the most valuable sales." The second question surfaces different winners.
The point is not to stop discounting or to kill promotional emails. It is to know which ones earn their place.
Frequently Asked Questions
Does Shopify Email show profit per campaign?
No. Shopify Email reports attributed revenue, orders, opens, and clicks. It does not calculate gross profit, because it does not know your product costs. You need a profit-analytics layer that ingests COGS to see per-campaign margin.
Can Klaviyo show email profit?
Klaviyo reports attributed revenue and can accept product cost data through custom properties, but its native reports focus on revenue and RPR (revenue per recipient), not gross profit or margin. Merchants who want profit per flow usually connect a Shopify profit analytics tool.
What margin should a Shopify email campaign hit?
There is no universal benchmark, because margin depends on category and average discount depth. A useful internal benchmark is the store's blended gross margin. Any campaign posting materially below it deserves a diagnosis: COGS, discount, or refunds.
How are refunds attributed back to an email campaign?
Bloom ties the refund to the original order, and the original order to the campaign or flow that drove it. Refunded revenue and refunded COGS are both netted out of the campaign's gross profit line.
Should I stop running discount-heavy email campaigns?
Not automatically. Some discount campaigns clear inventory or acquire high-LTV customers, and both can justify a thin margin on the first order. The point of measuring is to make that choice with the numbers in front of you rather than by feel.
Know Your Real Profit And
The Ads That Actually Sell.
No need to spend. Just try it on your store.