How to Use a Shopify Profit Margin Calculator Effectively
Learn how a Shopify profit margin calculator works, which costs to include, and how to find your store's true profit margin layer by layer.

A Shopify profit margin calculator tells you what you actually keep from each sale. But it only gives you an honest number if it counts all five cost groups: COGS, fulfillment, transaction fees, ad spend, and operating expenses. Most calculators stop at two, which is why so many store owners trust a margin number that turns out to be wrong.
This article walks through exactly which costs to include, the formula to use at each layer, and the mistakes that quietly inflate the number you think is profit.
Key Takeaways
A real profit margin calculator needs five cost groups, not two: COGS, fulfillment, transaction fees, ad spend, and operating expenses.
Calculate in layers. Gross margin (CM1) tells you about pricing. Contribution margin (CM2) tells you if a sale is worth fulfilling. Net margin tells you if the business actually works.
From what we've seen across Shopify stores, the gap between perceived gross margin and true net margin is often larger than owners expect, because costs like payment processing and ad spend get treated as separate line items rather than costs of the sale itself.
A spreadsheet works fine at low volume. Once order counts climb, manual entry errors compound and the margin number drifts.
What Does A Shopify Profit Margin Calculator Actually Show You?
A Shopify profit margin calculator takes your revenue and subtracts your costs to show two things: how many dollars you keep per sale (net profit) and what percentage of each sale that represents (profit margin). The more costs the calculator counts, the more honest the number it gives you. A basic one stops at product cost. A complete one counts everything down to operating expenses.
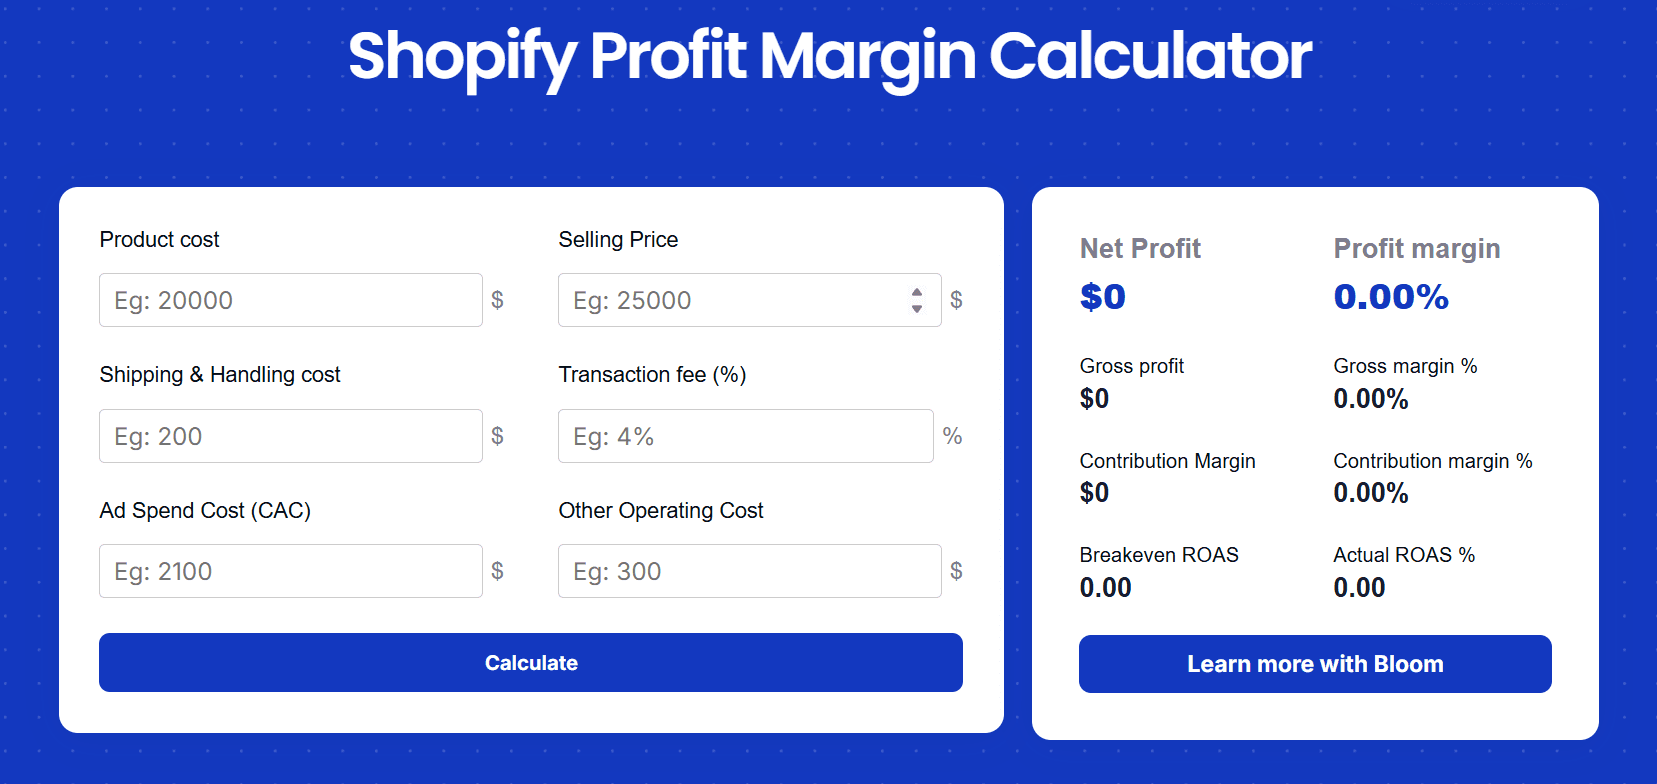
Two versions of margin matter most for a Shopify store.
Gross profit margin measures what's left after the cost of the product itself (COGS), divided by revenue. It tells you whether your pricing covers what you paid to source or make the item.
Net profit margin measures what's left after every cost: shipping, platform and transaction fees, packaging, ad spend, and operating expenses. It's the truest picture of whether your business actually makes money.
The gap between those two numbers is where most Shopify owners get surprised.
Why does your profit margin number matter more than revenue?
Revenue tells you nothing about whether you're keeping any of it. A store can post record sales and still lose money on every order. Margin is the signal that separates a business that's working from one that's growing itself into a hole.
Once you know your real margin, three decisions get much easier.
Pricing. You can see how much room you have to discount, bundle, or raise prices without dropping below break-even.
Cost control. You can spot which cost layer is eating the margin, whether that's shipping, ad spend, or fees, and go fix that one specifically instead of guessing.
Scaling. You only know whether you can afford to spend more on ads once you know what each sale leaves behind.
How To Calculate Shopify Profit Margin, Layer By Layer
The honest way to calculate margin is in layers, not one lump subtraction. Each layer answers a different question, and stopping at the wrong one is how owners end up trusting a number that was never real.
Here's a single example store carried through all three layers so you can see how they connect.
The example store, one month:
Line item | Amount |
Revenue | $60,000 |
COGS (product cost) | $27,000 |
Shipping and handling | $3,000 |
Transaction fees | $1,740 |
Ad spend | $12,000 |
Operating expenses | $9,000 |
Layer 1: How do you calculate gross profit margin (CM1)?
Gross profit margin is revenue minus the cost of the product itself, divided by revenue. It measures whether your pricing covers what the product costs to source. COGS here means the full landed cost, not just the supplier invoice.
COGS includes:
Product cost
Inbound supplier shipping
Import duties and taxes on the goods
Packaging that ships with the product
Formula: Gross profit = Revenue minus COGS
Gross profit = $60,000 minus $27,000 = $33,000
Gross profit margin = ($33,000 / $60,000) x 100 = 55%
A 55% gross margin means pricing is in solid shape before any of the operating reality hits. If this number were low, say under 30%, the fix lives in pricing or sourcing: raise the selling price, negotiate the product cost down, or cut packaging spend. No amount of ad optimization fixes a broken gross margin. That's the job this layer is designed to surface
Layer 2: What is contribution margin (CM2) and why does it matter?
CM2 is what's left after you subtract the cost to fulfill the order and the ad spend that won it. It's the single most useful day to day number for a DTC store, because it answers a blunt question: after I pay to make this sale and ship it, is there anything left?
Fulfillment and acquisition costs at this layer include:
Outbound shipping and handling
Transaction and payment gateway fees
Ad spend
Formula: CM2 = Gross profit minus Fulfillment costs minus Ad spend
CM2 = $33,000 minus ($3,000 + $1,740) minus $12,000 = $16,260
CM2 % = ($16,260 / $60,000) x 100 = 27.1%
The store kept 27.1 cents of every dollar after fulfillment and ads. That's a strong CM2. When this number gets thin, there are typically two culprits: shipping is too expensive for the margin the product carries, or ad spend is buying revenue that doesn't leave enough behind to pay for itself. Both are diagnosable once you're looking at this layer.
Layer 3: How do you calculate true net profit margin?
Net profit margin counts everything that's left after paying to run the business itself. This is the number that tells you, finally, whether the store works.
Operating expenses typically include:
Salaries and contractor pay
Rent and utilities
Software and app subscriptions
Taxes (VAT, GST, sales tax) and accounting
Formula: Net profit = Revenue minus (COGS + fulfillment + marketing spend + operating expenses)
Net profit = $60,000 minus ($27,000 + $3,000 + $1,740 + $12,000 + $9,000)
Net profit = $60,000 minus $52,740 = $7,260
Net profit margin = ($7,260 / $60,000) x 100 = 12.1%
That's a genuinely healthy result. But look at the journey: 55% at the gross line, 27.1% after ads and shipping, 12.1% once the business's own costs come out. The store sold $60,000 and kept $7,260. Revenue is not profit, and the only way to see the difference is to count every layer.
One note on terminology: if you bucket ad spend into CM2 the way many DTC operators do, your CM3 and your net profit land at the same number, because the only remaining subtraction is operating expenses. Different tools split these lines differently. What matters is that every cost is counted once, somewhere.
What Does A Healthy Profit Margin Look Like At Each Layer?
Use this as a gut check against your own numbers. These are general DTC reference ranges, not hard rules. Margins vary significantly by product category, AOV, and fulfillment model.
Metric | Healthy range | What a low number is telling you |
Gross profit margin (CM1) | 40% to 60% | Pricing or sourcing problem |
CM2 (after fulfillment + ads) | Above 20% | Shipping too high or ads inefficient |
Net profit margin | 10% to 20% | Operating costs or ad spend eating the business |
If your gross margin looks healthy but your net margin is near zero, the pricing isn't the problem. The leak is somewhere in the layers below. That's exactly the kind of thing a proper calculator surfaces in seconds.
What Mistakes Inflate Your Profit Margin Calculation?
Most inflated margin numbers come from the same handful of errors. Each one makes the business look more profitable than it is.

Confusing revenue with profit. The most common one. Revenue is what came in the door, not what you kept. They're rarely close.
Forgetting discounts and coupon codes. If half your orders used a 15% code, your real selling price isn't your list price. Calculators that use list price overstate every margin. We've found this is especially common during BFCM, when discount rates run high and stores are looking at their best revenue months.
Ignoring returns, refunds, and chargebacks. A returned order costs you the shipping both ways and often the product too. One bad return rate can erase a category's margin entirely.
Skipping transaction and platform fees. Payment processing alone runs roughly 2.9% plus a fixed fee per order. At scale that's real money, and most basic calculators ignore it.
Leaving out CAC. Ad spend is a cost of the sale, not a separate marketing line you can feel good about. If it isn't in the margin math, the margin is fiction.
Pricing off competitors instead of costs. Matching a competitor's price tells you nothing about whether that price works for your specific cost structure.
Should You Use A Spreadsheet Or A Profit Margin Calculator?
A spreadsheet works fine when you're doing a few orders a day and have time to update it manually. The problems start when order volume climbs, costs change week to week, and one wrong cell throws off the whole month.
Manual spreadsheet | Profit margin calculator | |
Data entry errors | High | Low |
Calculation mistakes | High | Low |
Time per update | High | Low |
Accuracy | Moderate | High |
Pulls live Shopify data | No | Yes |
Speed of decisions | Slow | Fast |
Manual math is fine until it isn't. Once you're past a steady order volume, the real value of a calculator isn't the arithmetic. It's that it pulls real numbers from your store automatically and removes the human errors that quietly make the margin wrong.

Most basic calculators still fall short here, though. A lot of them only ask for product cost, markup, and shipping. That gets you a gross margin and stops. That's exactly the half-finished number this whole post is warning about. To see true profit, the calculator has to count transaction fees, discounts, returns, ad spend, and operating expenses too.
That's the gap Bloom, our profit app for Shopify stores, is built to close. Instead of asking you to key costs into a sheet, Bloom pulls real COGS, shipping, fees, and ad spend straight from your Shopify data and shows true net profit, not just revenue, in one dashboard. Same layered logic you just walked through, calculated automatically and updated daily.
Bottom line
A profit margin calculator is only as honest as the costs you feed it. Stop at product cost and shipping and you'll get a number that flatters you. Count every layer, COGS, fulfillment, fees, ad spend, and operating expenses, and you get the one number worth running your business on: what you actually keep.
Calculate it in layers. Gut check each layer against the healthy ranges. Fix the layer that's leaking. That's the whole discipline.
If you'd rather not maintain the spreadsheet, Bloom is free to try on Shopify and pulls your real numbers in automatically. If you'd prefer a walkthrough first, the consultation call is on us.
FAQ
Which profit margin should I calculate to see my true profit?
Calculate net profit margin. Gross margin only accounts for product cost, so it overstates what you keep. Net margin subtracts everything: shipping, transaction and platform fees, discounts, returns, ad spend, and operating expenses. It's the only layer that reflects the cash your business actually retains once a sale is fully done.
What's a good profit margin for a Shopify store?
Net margins vary widely by product category and business model. A margin around 10% is broadly considered healthy for ecommerce, below 5% leaves little room for error, and above 20% is strong. Gross margins tend to run higher, often in the 40% to 60% range for DTC brands, but operating costs and ad spend pull the net figure down significantly from there. Your own cost structure matters more than any industry average.
Does a profit margin calculator include ad spend and returns?
Most basic ones don't. Many free calculators only ask for product cost, markup, and shipping, which gets you gross margin, not true profit. To see real profitability, the calculator has to include ad spend, transaction fees, discounts, and returns. Tools that pull live data from your store, like Bloom, count all of these automatically.
Why is my revenue high but my profit so low?
Because revenue is the money that came in, not the money you kept. Between the two sit COGS, shipping, payment fees, discounts, returns, ad spend, and operating costs. A store can do $60,000 in sales and keep $7,000 once all of those come out. The fix is to calculate margin in layers so you can see exactly which cost is doing the damage.
What's the difference between gross margin and contribution margin?
Gross margin subtracts only your product cost (COGS) from revenue. Contribution margin (CM2) goes further: it subtracts fulfillment costs and ad spend too. CM2 is the more useful day-to-day number for a DTC store because it tells you whether a specific sale was worth making after you account for what it cost to win and ship it, not just what the product cost to source.
Can I calculate profit margin in a spreadsheet instead of a calculator?
Yes, and it works well at low order volume. The downside is manual data entry, which gets slow and error-prone as orders grow and costs change. A single wrong cell can misstate a whole month. A calculator that connects to Shopify pulls the numbers automatically, which removes that error risk and keeps your margin current without the upkeep.
Know Your Real Profit And
The Ads That Actually Sell.
No need to spend. Just try it on your store.


