


If you're a Shopify store owner selling internationally, it's natural to wonder where your international sales are actually coming from. How much revenue did the UK generate? Which countries place the most orders? Which markets are growing fastest? Shopify's Sales by Country report answers those questions by breaking down your sales across different markets.
But once you start deciding where to increase ad spend, expand fulfillment, or localize your store, sales alone isn't enough. Differences in shipping costs, advertising spend, transaction fees, and fulfillment expenses can make two markets with similar sales perform very differently.
That's why you also need to understand how much profit you're making in every key market where you sell.
This guide walks through what Shopify's Sales by Country report measures, what it doesn't, and how analyzing country profitability helps you identify which markets to scale, optimize, or expand into next.
Why Country-Level Sales & Profit Analysis Matters for Growth
When a Shopify store starts receiving orders from multiple countries, the natural question is where to invest next: which markets get more ad budget, which benefit from a dedicated shipping arrangement, which are worth testing with localized pricing or faster delivery options. Without country-level data, those decisions are guesswork rather than strategy.
For D2C brands in particular, this question carries real weight. Shipping internationally to the US, UK, Germany, and Australia opens up substantial revenue, but the cost structures in each market differ enough that a market that looks strong on revenue can quietly become unprofitable once you account for ad spend, shipping costs, and payment processing fees. The country generating the most revenue is not automatically the one generating the best return on your investment.
Country-level sales analysis is the first layer of answering that question. Country-level profit analysis is where the decision actually becomes clear.
TL;DR
Shopify's Total Sales by Billing Location report shows orders, revenue, gross profit, and gross margin by billing country.
It's useful for comparing international sales performance but doesn't include operational or marketing costs.
True country profitability requires combining sales with costs like shipping, fulfillment, transaction fees, tariffs, and ad spend.
Bloom automatically calculates country profitability, helping you identify which markets to scale, optimize, or monitor.
How to See Sales by Country in Shopify
Finding the Total Sales by Billing Location Report
From your Shopify admin, go to Analytics > Reports > Sales > Total Sales by Billing Location. The report groups orders by the customer's billing country entered at checkout, which usually matches the shipping destination but may differ for gift orders, corporate purchases, or customers shipping to another address.
This report is available on the Shopify plan and above. If you're on the Basic plan, you'll need to export your order data or use a third-party analytics app to analyze sales by country.
What the Report Includes
The Total Sales by Billing Location report breaks down Orders, Gross Sales, Discounts, Returns, Net Sales, Shipping Charges, Taxes, Total Sales, Gross Profit, and Gross Margin for each billing country. Gross Profit is calculated as Net Sales minus the cost of goods sold (COGS), but it is only accurate if product costs have been entered in Shopify. Each row represents a billing country, although orders without a billing country may appear as blank or unknown. You can sort the report by any metric to quickly identify which markets generate the highest revenue, gross profit, or order volume.
Filtering and Exporting
You can adjust the date range to analyze sales over a specific period. Depending on your Shopify plan, you can further customize the report using the ShopifyQL Editor. You can also export the report as a CSV to share with your marketing, logistics, or finance teams or for further analysis.
What the Report Tells You
Here's an example of how the report looks across five markets. All figures are illustrative and do not represent real merchant data.
Country | Orders | Gross Sales | Discounts | Returns | Net Sales | Gross Profit | Gross Margin |
United States | 1,240 | $124,800 | $8,700 | $6,200 | $109,900 | $54,950 | 50% |
United Kingdom | 680 | $52,400 | $3,100 | $2,800 | $46,500 | $25,575 | 55% |
Australia | 420 | $38,600 | $1,900 | $1,200 | $35,500 | $21,300 | 60% |
Germany | 510 | $44,200 | $5,800 | $4,100 | $34,300 | $15,435 | 45% |
India | 290 | $18,400 | $2,200 | $800 | $15,400 | $8,470 | 55% |
Reading left to right, the report answers several useful questions. The US leads on orders, revenue, and gross profit in absolute terms. Germany generates reasonable gross sales, but heavy discounts and returns pull net sales down to levels closer to Australia, a market with roughly half the order volume. Australia carries the strongest gross margin at 60%, meaning it retains the highest proportion of each sale after product costs.
The report helps you identify which markets are generating the most sales and revenue, and which retain stronger gross margins. But notice what the table cannot show: two markets with identical gross profit figures could have very different outcomes once the actual cost of serving each market is taken into account.
What Gross Profit Doesn't Show You
Gross Profit tells you what remains after product costs. Before you use it to compare markets, there is an important limitation to understand: the figure is only calculated for orders where product costs have been entered in Shopify. If costs are missing for some products or variants, those orders are excluded from the calculation entirely, which means your reported Gross Profit will be lower than your actual margin. Before comparing markets, confirm that your COGS data is complete.
Even with accurate product costs, Gross Profit doesn't tell you what your business actually keeps from each market. Four cost layers sit between Gross Profit and the number that actually matters for expansion decisions.
Marketing spend. Acquiring customers in international markets through paid channels costs money that Shopify's report never sees. A country can appear highly profitable before advertising but become one of your weakest markets once acquisition costs are included. The US in the example above may carry significant Meta or Google spend. Australia's strong margin may reflect mostly organic or returning customers. The table cannot tell you which.
Shipping and fulfillment. International shipping rates, duties, and third-party logistics costs vary significantly by destination. Higher fulfillment costs can reduce a country's margin even when its revenue remains strong, and that compression is invisible in Shopify's gross profit figure.
Payment processing fees. Cross-border transactions often carry higher processing fees than domestic ones. The difference may be small per order, but across a high-volume market it compounds into a meaningful cost that doesn't appear in the report.
Customs, duties, and country-specific costs. Import regulations and tax obligations differ by market and can add costs the customer may reject post-purchase, increasing return rates or reducing repeat likelihood.
Shopify's report is accurate for what it measures, but it stops at gross profit. If you're deciding where to increase ad spend, localize your storefront, negotiate a regional fulfillment arrangement, or commit to a new international market, gross profit alone isn't enough to make that call confidently. Each of those decisions carries real cost, and the return on that investment depends on understanding each market's true profitability.
How to Analyze Country Profitability
The goal of analyzing profit by country isn't to report more metrics, but to understand what those metrics mean for your next investment decision. That means understanding which countries deserve more advertising budget, which markets need cost optimization before scaling, what's driving lower margins in each market, and which smaller countries are profitable enough to justify expansion.
For merchants looking to analyze profitability by country rather than sales alone, Bloom provides a dedicated Country Profit dashboard. It combines Shopify sales data with product costs, shipping, handling, transaction fees, tariffs, and marketing spend from connected ad platforms to calculate profitability for every market you sell in.
Once you connect your Shopify store and add the costs unique to your business, Bloom automatically calculates country profitability and organizes the analysis into two complementary views.
Country Gross Profit
The first view, Country Gross Profit, includes several visualizations that analyze profitability before marketing costs are included. By combining revenue with product costs, shipping, handling, transaction fees, and tariffs, it helps you understand how operational costs affect profitability across different markets.
The Revenue vs. Profit chart compares revenue with operational profit, making it easy to see how much of each country's revenue is absorbed by operational costs. A large gap between the two highlights countries where operational costs are reducing margins, even when sales remain strong.
As you can see here, the United Kingdom and Germany generated the highest revenue, but the gap between revenue and profit showed that a significant portion was being consumed by operating costs. Whereas, markets such as Denmark and Norway, although smaller in revenue, retained a larger share as operational profit, pointing to stronger margins before advertising.
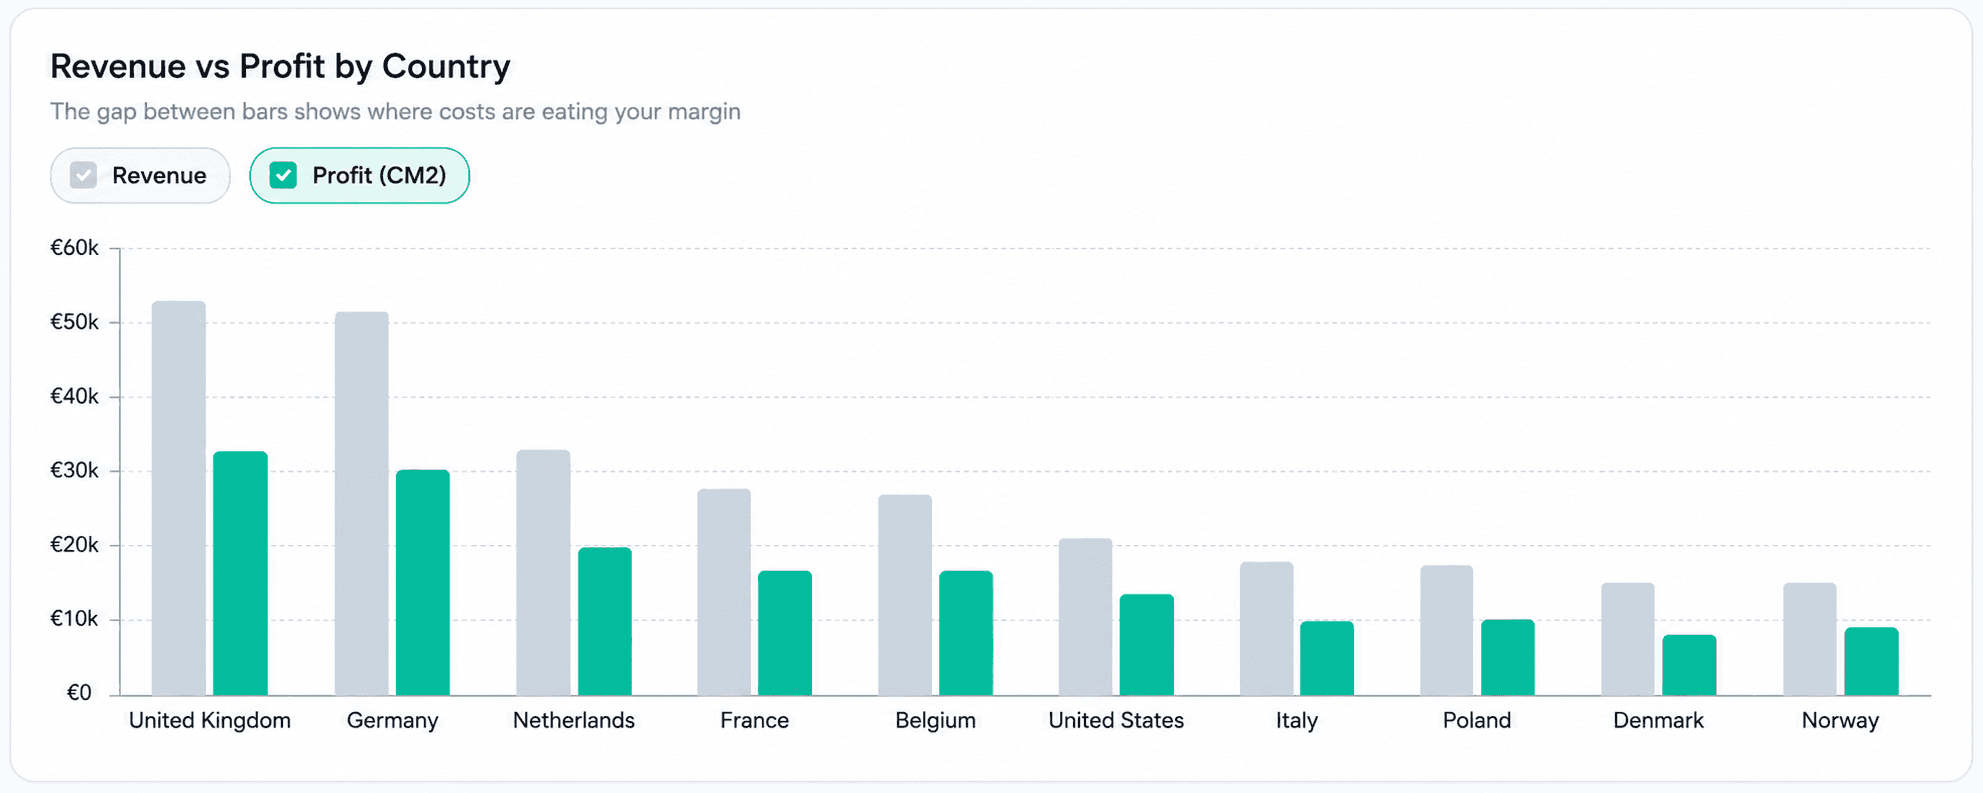
A separate cost breakdown will show you which cost is responsible for that gap: shipping, handling, transaction fees, tariffs, or product costs. Instead of simply knowing that margins are lower in a particular market, you can see specifically what needs fixing.
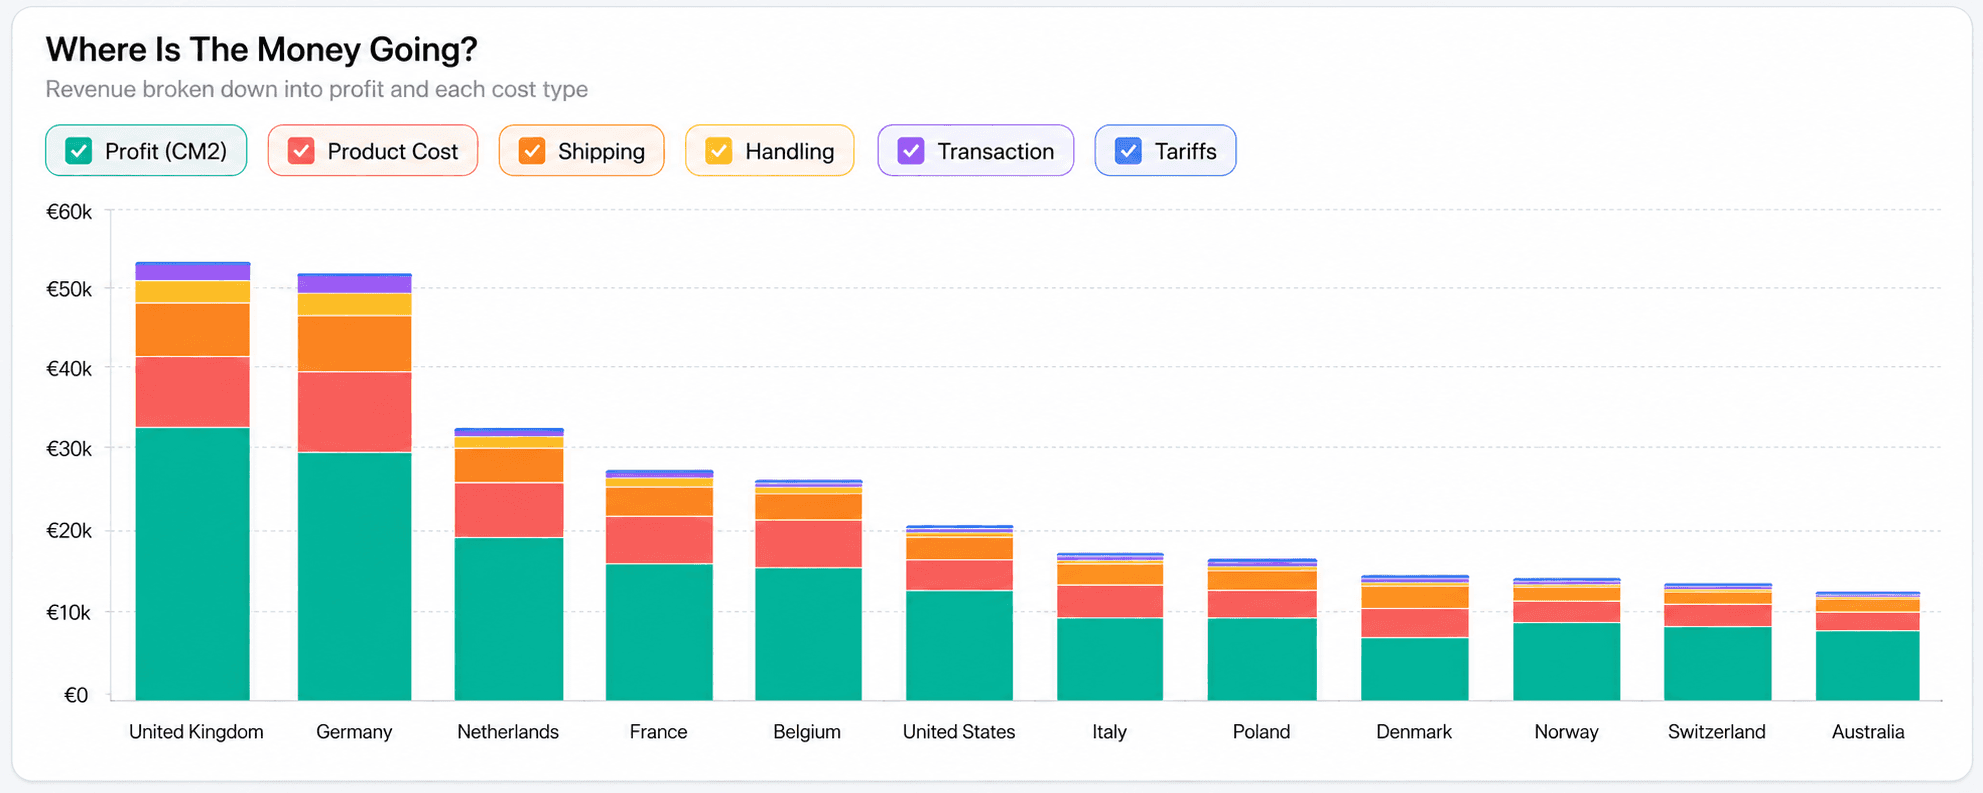
The final view brings all markets together, making it easier to decide where to act next. It brings together key metrics such as orders, net revenue, CM2, shipping impact, and profit margin, then automatically segments countries into Scale, Fix Costs, Invest, Review, and Watch based on their performance.

Country Profit Margin
The second view, Country Profit Margin, adds ad spend from connected platforms on top of the operational cost layer. This calculates the true contribution margin (CM3) for each country, along with ROAS and CPA, making it easier to distinguish between operational and marketing-related profitability issues.
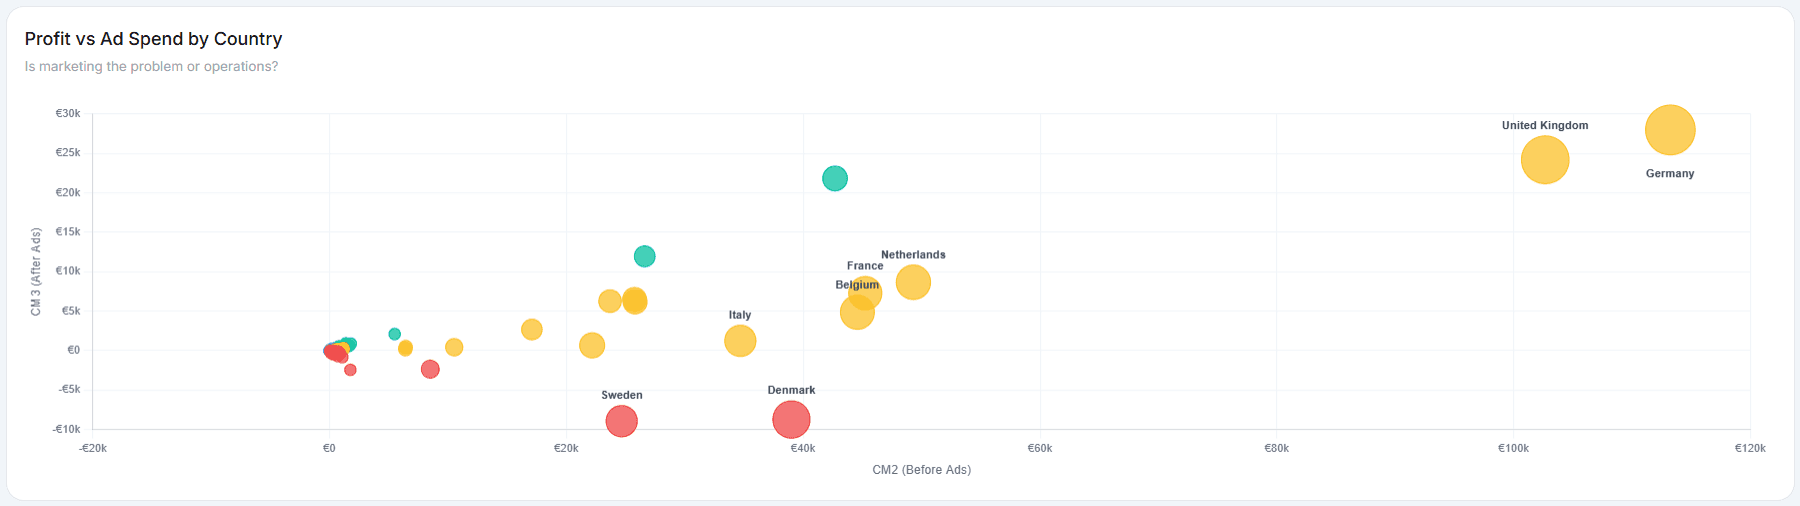
The Profit vs. Ad Spend chart compares profitability before and after advertising, helping explain why margins shift once marketing costs are included. For the same store, the United Kingdom and Germany remained profitable after ads, suggesting they can still support growth, although improving campaign efficiency would increase returns. Denmark and Sweden turned unprofitable after advertising, indicating that additional spend is unlikely to improve results until operational margins or campaign performance improve.
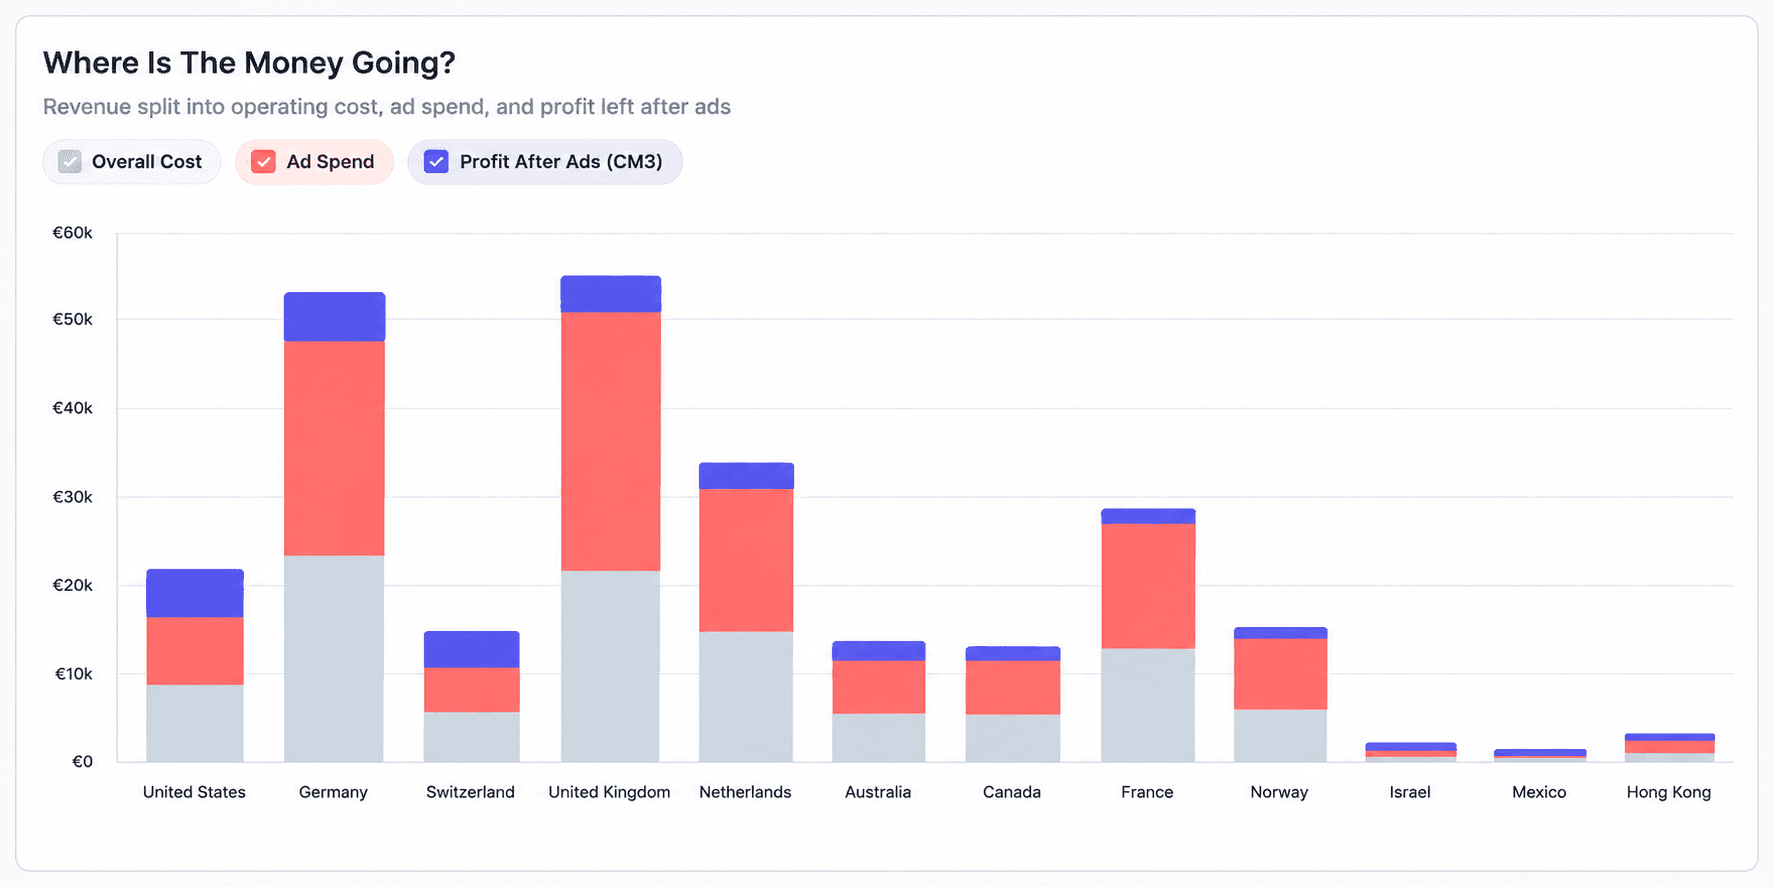
If you are wondering "Where Is the Money Going?", the below insight shows how each country's revenue is split across operating costs, advertising spend, and profit after ads.
While the United Kingdom and Germany generated the highest revenue, a significant share was consumed by advertising, leaving relatively little profit after marketing. The United States retained a larger share of its revenue as profit, making it the stronger option for additional investment.
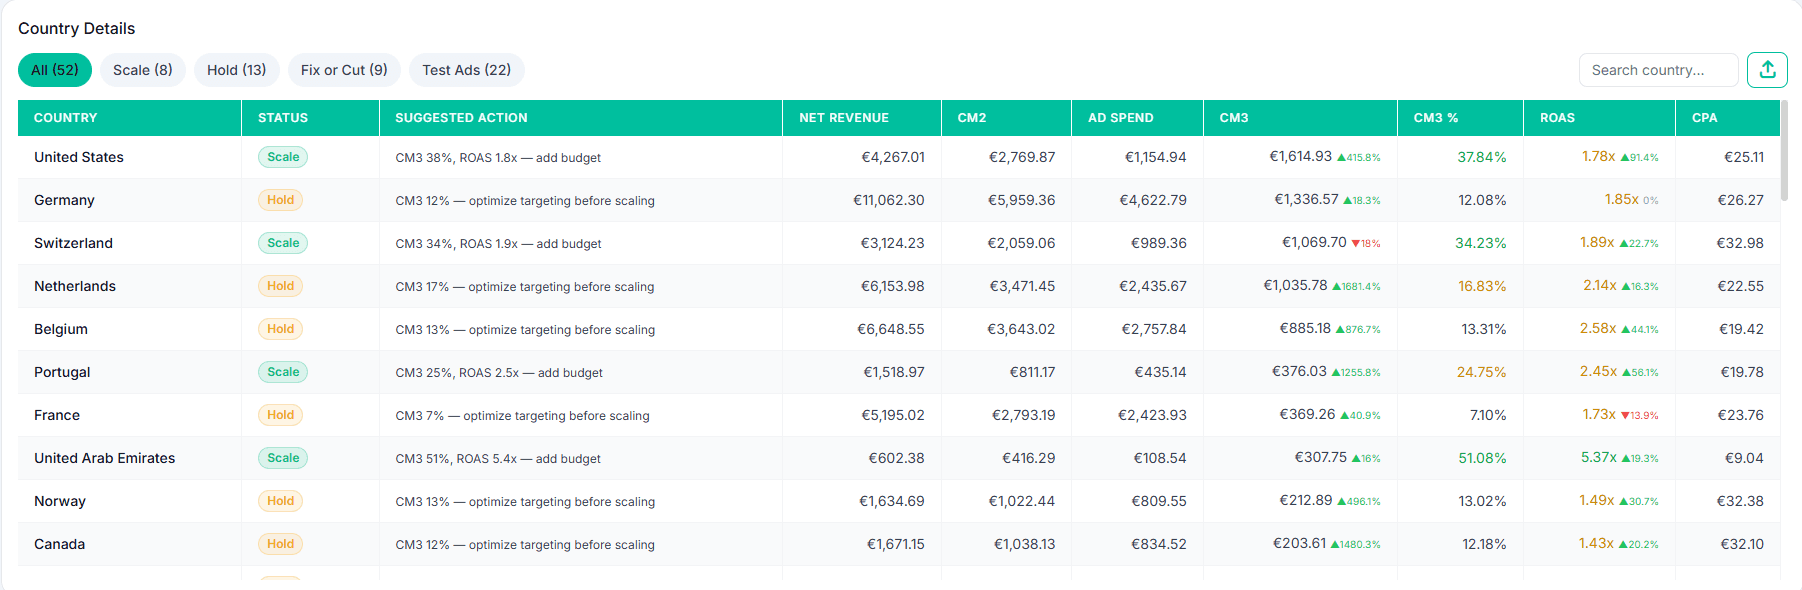
Like the Country Gross Profit view, you can compare every market side by side, this time using metrics such as CM3, ROAS, CPA, and profit margin to understand performance after advertising. Countries are automatically grouped into categories with a recommended next action, making it easy to identify where to scale, optimize campaigns, or test new opportunities.
In this store, the United States is identified as Scale because it continues to generate healthy profit after advertising. The United Kingdom and Germany are classified as Hold because campaign performance should be improved before increasing ad spend. Markets already generating profitable sales without paid acquisition are grouped under Test Ads, identifying where new campaigns can be tested with lower risk.
Invest Based on Profit, Not Just Sales
Expanding internationally is exciting, but knowing where to expand isn't always obvious. The Total Sales by Billing Location report is a good place to start. It tells you where your sales are coming from and which countries generate the most orders and revenue. When you're deciding where you're thriving and where adjustments might be needed, understanding which markets generate profitable growth is far more valuable than knowing which ones generate the most sales.
That requires connecting revenue with the costs of acquiring and serving customers in each market, so you can confidently decide where to invest, scale, or improve profitability. If you're looking for that level of insight, take a look at how Bloom analyzes country profitability.

Frequently Asked Questions
How do I see sales by country in Shopify? In your Shopify admin, go to Analytics > Reports > Sales > Total Sales by Billing Location. The report shows Orders, Gross Sales, Discounts, Returns, Net Sales, Gross Profit, and Gross Margin for each billing country, organized by the billing address entered at checkout. It is available on Shopify's Basic plan and above, with additional filtering options available through the ShopifyQL Editor on higher plans.
Does Shopify show profit by country? Shopify's Total Sales by Billing Location report includes Gross Profit and Gross Margin columns, calculated as Net Sales minus cost of goods sold for orders in each country. The figures are only accurate if product costs have been entered for every product and variant in Shopify. The report does not account for marketing spend, country-specific fulfillment costs, or other operational expenses, so it reflects gross profit rather than true net profit by country.
Why isn't gross profit enough to make international expansion decisions? Gross Profit stops at product costs. It doesn't subtract the marketing spend required to acquire customers in each market, country-specific shipping and fulfillment costs, payment processing fees on cross-border transactions, or customs and import duties. Each of those costs varies by geography, which means two markets with identical gross profit figures can require entirely different decisions once the full cost of serving them is applied.
Why is my highest-revenue market not necessarily my most profitable one? Revenue reflects sales volume before any costs are applied. A high-revenue market with heavy paid acquisition, elevated return rates, or expensive international fulfillment may contribute less actual profit than a lower-revenue market where those costs are more contained. The gap between what a country earns and what the business keeps after all costs is what makes country-level profit analysis different from country-level revenue analysis.
What is CM3 and why does it matter for country analysis? CM3, or Contribution Margin 3, is the profit remaining after product costs, fulfillment costs, and marketing spend have all been deducted from net revenue. It is the most complete margin figure available before fixed overhead is applied, and it is the metric that measures true country-level profitability once all variable costs are included.
Discover More