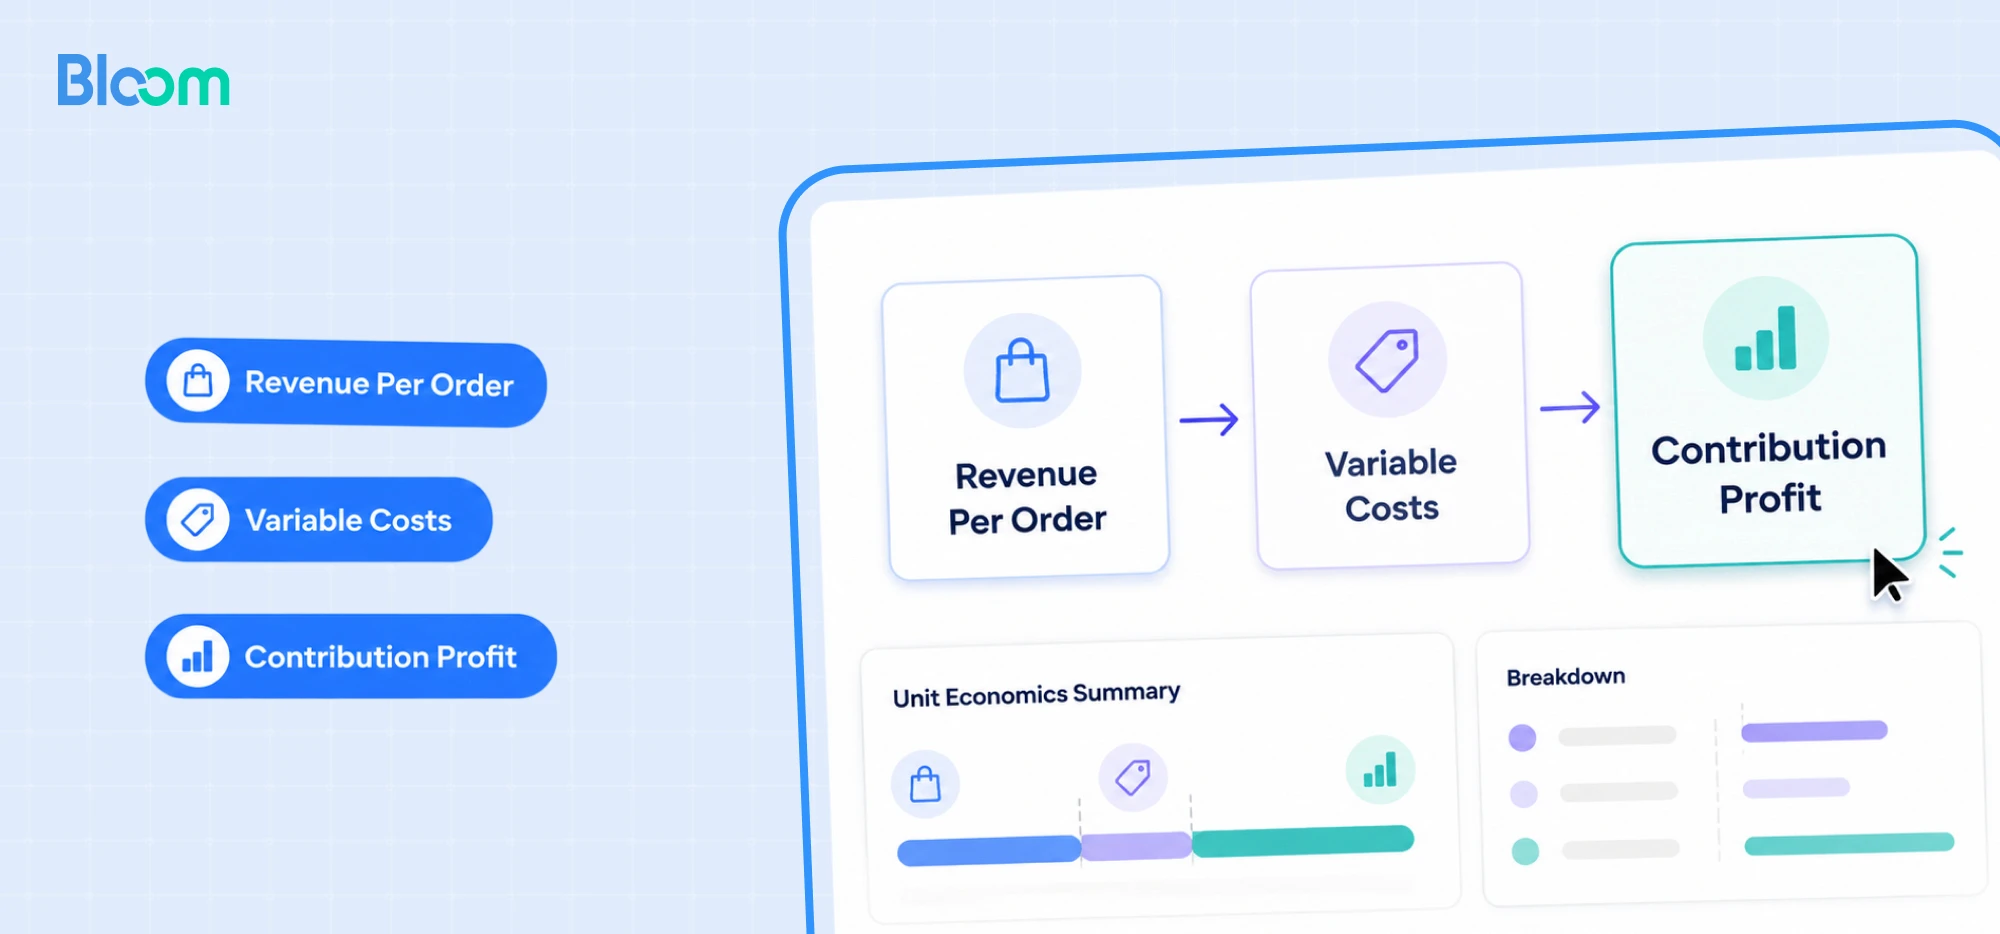
Most sellers go from gross profit straight to net profit, without stopping to measure what happens in between. They end up in trouble, because they skipped a crucial checkpoint.
That checkpoint is your contribution margin. It tells you whether your ad strategy is actually sustainable, or whether you are quietly burning cash to chase revenue that never turns into profit.
Here is the catch. "Contribution margin" is not a single number, and that is exactly where most Shopify store owners get lost. It is a funnel with three stages, and the difference between the top of that funnel and the bottom is often the difference between a store that scales and one that stalls. By the end of this post you will know how to calculate each stage, how to read it, and how to use it to decide where your next ad dollar should go.
TL;DR
Contribution margin is not one number. It is a funnel: CM1 (after product cost), CM2 (after fulfillment), CM3 (after ad spend).
The metric most merchants call "contribution margin" is usually just gross profit, which is CM1. That gap is where money quietly disappears.
The honest test for whether an ad can sell a product profitably is BEROAS (break-even ROAS), calculated from your real cost stack, not from revenue.
A worked example below turns a 19.7% contribution margin into 46.7% with three changes to pricing, packaging, and ad targeting.
For a Shopify store, this whole funnel can be tracked automatically instead of rebuilt in a spreadsheet every month.
What is Contribution Margin in Ecommerce?
Contribution margin is what is left from each sale after you subtract the variable costs of making that sale. In ecommerce, those variable costs build up in layers: first the product, then fulfillment, then the ad spend that brought the order in. Each layer you subtract gives you a different, more honest view of profit. The number left at the bottom is what is available to cover your fixed costs and become net profit.
That layered build-up is the part most people miss. They calculate one number, call it "contribution margin," and make decisions on it. But a single number hides which layer is leaking. The fix is to treat contribution margin as a funnel.
The Contribution Margin Funnel: CM1, CM2, CM3
Contribution margin moves through three stages, and each one strips out a different cost. Understanding all three is what separates a merchant who knows their numbers from one who is guessing.
CM1 = Revenue − COGS. What is left after what you paid for the product itself. This is also called gross profit, and it is the stage most people stop at.
CM2 = CM1 − fulfillment costs. What is left after shipping, packaging, pick-and-pack, and handling. This is the first time the real cost of delivering an order shows up.
CM3 = CM2 − ad spend. What is left after the marketing cost to win the order. This is the number that tells you whether your ads are actually paying for themselves.
Read top to bottom, the funnel answers three different questions. CM1 asks whether your pricing covers the product. CM2 asks whether you can afford to ship it. CM3 asks whether you can afford to advertise it. A product can pass the first test and fail the third, which is why a single "contribution margin" figure is so misleading.
After CM3, only your fixed operating costs (rent, salaries, software) stand between you and net profit. That makes CM3 the closest thing to a daily profit reading you have, because everything below it is relatively fixed month to month.
The Common Misconception: Contribution Margin is Not Gross Profit
The single most common mistake is calling gross profit "contribution margin." Gross profit is Revenue − COGS, which is CM1, the very top of the funnel. Real contribution margin keeps going, subtracting fulfillment and ad spend on the way down. Treating CM1 as your contribution margin makes a product look far healthier than it is.
These metrics are closely related, but they are divided by thin lines. Here is a clear comparison.
Metric | Gross Margin (CM1) | Contribution Margin (CM2,CM3) | Net Profit Margin |
Formula | Revenue − COGS | Revenue − COGS − fulfillment − ad spend | Revenue − all costs |
Covers | Product cost only | Product cost, fulfillment, ad spend | Product cost, fulfillment, ad spend, operating costs (rent, salaries, software) |
Use case | Pricing strategy, supplier negotiation | Break-even analysis, scale decisions and | Net earnings, long-term growth |
Key question | What do I make after the variable cost of the product? | What is left to cover fixed costs after shipping and ads? | What profit can I reinvest? |
The takeaway: contribution margin cannot be understood in isolation. It only makes sense in relation to gross profit above it and net profit below it. Skip the middle of the funnel and you are pricing, scaling, and budgeting on a number that does not exist.
How to Calculate Contribution Margin
To calculate contribution margin, subtract your variable costs from revenue one layer at a time: Revenue − COGS gives CM1, minus fulfillment gives CM2, minus ad spend gives CM3. The contribution margin percentage at any stage is that stage's dollar figure divided by revenue, times 100.
Here is each input in plain terms:
Revenue is the total income from selling the product, before any costs come out.
COGS is the direct cost of producing or sourcing the product.
Fulfillment is shipping, packaging, and handling to get the order to the customer.
Ad spend is the marketing cost to acquire the order.
And the percentage formula, written so the math actually works:
Contribution Margin % = ((Revenue − COGS − fulfillment − ad spend) ÷ Revenue) × 100
That parenthesis matters. Without it, order of operations divides only ad spend by revenue and the number comes out nonsense. Calculate the dollar margin first, then divide by revenue.
Why Contribution Margin Matters
Say you run a store selling a premium insulated coffee tumbler, doing about 1,000 orders a month. Here is how a typical month performs across the full funnel in two scenarios: one with a weak contribution margin, one after a few deliberate changes to pricing, packaging, and ad targeting.
Line item (monthly, ~1,000 orders) | Scenario 1: Low CM | Scenario 2: Improved CM |
Revenue | $45,000 | $60,000 (upgraded positioning) |
Product cost (COGS) | $18,000 | $18,000 |
Transaction fees (2.5%) | $1,125 | $1,500 |
= CM1 (after COGS and fees) | $25,875 | $40,500 |
CM1 margin % | 57.5% | 67.5% |
Shipping and handling | $6,000 | $4,500 (negotiated rate, better packaging) |
= CM2 (after fulfillment) | $19,875 | $36,000 |
CM2 margin % | 44.2% | 60.0% |
Ad spend | $11,000 | $8,000 (retargeted traffic, better creative) |
= CM3 (after ad spend) | $8,875 | $28,000 |
CM3 margin % | 19.7% (weak) | 46.7% (strong) |
Operating costs | $5,000 | $5,000 |
= Net profit | $3,875 | $23,000 |
Net profit margin % | 8.6% | 38.3% |
Look at what the funnel exposes. If you judged this store on CM1 alone, the month looks great in both scenarios, over 57% either way. You would happily push more spending in. But CM3 tells the real story. In Scenario 1, only 19.7% survives the trip down the funnel, and after $5,000 of operating cost the store keeps just $3,875 on $45,000 of revenue. That is a month one bad ad week away from going negative.
This is the trap of stopping at gross profit. The store looks scalable at the top of the funnel and fragile at the bottom. Only by walking from CM1 to CM2 to CM3 do you see where the money actually goes each month.
How BEROAS connects to your contribution margin
So how do you know when an ad can sell a product profitably? Break-even ROAS (BEROAS) answers that. It is the minimum return on ad spend you need before the ads start losing money, and it comes straight from your pre-ad margin.
The formula depends on how you track shipping:
Shipping tracked per product: BEROAS = Selling price ÷ (Selling price − COGS − fulfillment), built on CM2.
Shipping tracked per order (most stores): BEROAS = Selling price ÷ (Selling price − COGS), built on CM1, because a per-product fulfillment figure would only be an estimate, and you should not set a break-even target on an estimate.
Then the read is simple: if actual ROAS beats your BEROAS you are profitable on the product, if it falls short you are losing money on every sale, and if they match you are breaking even.
This is also where platform numbers stop being trustworthy. Your ad platform reports ROAS from revenue, not from your real cost stack, so a campaign can show 4x in Meta and still sit below the BEROAS your margins actually require. That gap is where a lot of "profitable" stores quietly bleed. (We break the full BEROAS calculation, including both shipping cases, down in a separate guide.)
How to improve your contribution margin
Improving contribution margin means widening the gap between revenue and variable costs at each layer of the funnel. Here is how the store above moved from a 19.7% CM3 to 46.7%, using three changes that any DTC store can apply.
Cut monthly ad spend by $3,000, from $11K to $8K. Focus budget on high-intent buyers to lower acquisition cost, retire underperforming creative, and re-engage warm audiences who are likelier to convert. Lower CAC flows straight into CM3.
Lower shipping and handling by $1,500, from $6K to $4.5K. Negotiate carrier rates, optimize packaging weight and dimensions, and bulk-ship where possible. Every dollar saved on fulfillment lifts CM2, which lifts everything below it.
Raise the average selling price (here, the $45 to $60 repositioning). Justify a premium through design, insulation quality, and brand positioning, staying within what the market will bear. A higher price lifts CM1 and gives every layer beneath it more room.
The result is a 46.7% CM3, more than enough to cover the $5,000 operating cost and still leave $23,000 in real monthly profit on $60,000 of revenue. That is the same store, repriced and re-costed around the funnel instead of around gross profit alone.
What is a good contribution margin for a Shopify store?
There is no universal number, but across healthy DTC stores a contribution margin above 50% (at the CM2 level, before ad spend) gives you room to advertise aggressively, cover fixed costs, and still make a profit. Below roughly 30%, scaling gets dangerous fast, because a small rise in CAC or shipping can wipe out what is left.
The right target depends on your business model, stage, product category, and acquisition strategy. An early-stage brand chasing market share might deliberately accept a thinner contribution margin to win customers, betting on repeat purchases later. A mature brand optimizing for cash should hold the line higher. The principle holds either way: the more you keep at each layer of the funnel, the more options you have.

How Bloom Helps You Act on Contribution Margin
Everything above can be built in a spreadsheet. The problem is that the funnel changes every day as orders, shipping costs, refunds, and ad spend move, and a static spreadsheet is out of date by the time you finish it.
This is the kind of view Bloom builds automatically from your Shopify data. Bloom, our profit and attribution app for Shopify stores, pulls your real COGS, actual shipping costs, refunds, discounts, and ad spend into a single profit view, then shows the margin at each layer of the funnel without you rebuilding it by hand. So instead of finding out at month-end that only 19.7% of revenue survived to CM3, you watch CM2 and CM3 move day by day and catch the leak while you can still act on it.
The point is not to replace your judgment. It is to give you the bottom of the funnel in real time, so the checkpoint you are most likely to skip is the one you see first.
You can try Bloom free on Shopify, or book a demo call with the team if you want a guided look at your store's profit funnel first.
FAQ
Is Contribution Margin the Same as Gross Profit?
No. Gross profit is Revenue − COGS, which is only the first layer (CM1). Contribution margin continues down the funnel, subtracting fulfillment (CM2) and ad spend (CM3). Calling gross profit your contribution margin makes a product look healthier than it is, because it ignores the shipping and marketing costs that determine whether the sale actually pays.
What is the Formula for Contribution Margin Percentage?
Contribution margin percentage is ((Revenue − COGS − fulfillment − ad spend) ÷ Revenue) × 100. You can run the same formula at any funnel stage by stopping at CM1, CM2, or CM3 depending on which costs you have subtracted.
What Is A Good Contribution Margin For Ecommerce?
A CM2 above 50% (before ad spend) is a healthy benchmark for most DTC stores, since it leaves room to advertise, cover fixed costs, and keep profit. Below 30% makes scaling risky. The ideal depends on your stage and category. Early-stage brands sometimes accept thinner margins to win customers, while mature brands hold higher to protect cash.
What Is A Bad Contribution Margin?
A contribution margin below roughly 30% at the CM2 level is a warning sign. At that level, a small increase in customer acquisition cost, shipping, or refunds can erase your remaining profit. It does not always mean the product is unviable, but it does mean you have little cushion to scale ads or absorb cost shocks without slipping into a loss.
How Does Contribution Margin Relate to Net Profit Margin?
Contribution margin (CM3) is what remains after all variable costs: product, fulfillment, and ad spend. Net profit margin goes one step further and subtracts fixed operating costs like rent, salaries, and software. CM3 tells you whether each sale carries its own weight. Net profit tells you whether the whole business does. Watching CM3 daily is how you protect net profit monthly.
Discover More