Ecommerce Unit Economics: Easy and Practical Analysis
Ecommerce unit economics shows whether each new customer is profitable. Here is how to calculate it step by step, with a worked example and CAC payback.
Ecommerce unit economics is the profit math for a single customer: the revenue one new customer brings in, minus every cost it takes to fulfill their order and acquire them. Run it, and you know whether your growth is building profit or quietly burning it.
This guide walks through how to calculate unit economics for ecommerce step by step, following one new customer's money from first click to final margin. By the end you will be able to answer the three questions that decide how you spend:

Customer value: are my customers profitable?
Ad profitability: are my ads paying for themselves?
Scale decision: should I spend more, hold, or pull back?
Key Takeaways
Unit economics is measured per new customer, not per order and not blended across all revenue.
The chain is: net new-customer AOV, minus variable order costs, minus CAC, equals unit contribution margin.
A negative first-order margin is not automatically a problem if repeat purchases pay back CAC inside your target window.
A common operating rule is to recover CAC within 60 days of acquisition.
What is Ecommerce Unit Economics?
Unit economics for ecommerce measures the profit and cost of your business on a per-customer basis. Instead of looking at total monthly revenue, you isolate one new customer and trace their money down through every cost until you reach the profit that is left.
The "unit" in ecommerce is the customer, not the product or the order. That distinction matters because acquisition cost attaches to the customer, not to any single order they place.
Two rules keep the number honest:
Use new customers only. Repeat-customer revenue did not cost you acquisition spend this period, so mixing it in inflates your economics and hides whether new acquisition is working.
Use net revenue. Deduct returns and refunds so you are measuring money you actually kept.
Get those two right and unit economics becomes a decision tool rather than a vanity number.
How to Calculate Ecommerce Unit Economics Step by Step
The calculation is a waterfall. You start with what one new customer paid you, then remove each cost layer in order.
Step 1: Start with net new-customer revenue (AOV)
Take your revenue from new customers during the period, net of returns and refunds, and divide by the number of new customers. That gives you Average Order Value (AOV) for a new customer.
New-customer AOV = net new revenue / new customers
Excluding repeat revenue here is the step most stores skip, and it is the one that quietly flatters the whole model.
Step 2: Subtract your variable order costs
Next remove the variable costs of fulfilling that order: the costs that rise with each sale. Do not include fixed operating costs like rent or salaries. Those belong to overhead, not unit economics.
Typical variable order costs:
Cost of goods sold (COGS)
Inventory and warehousing cost tied to the unit
Packaging
Shipping and return shipping
Transaction and payment gateway fees
Platform and marketplace fees
Sales commissions
Add these up, divide by new customers to get cost per customer, and subtract.
Gross unit profit = new-customer AOV - variable order cost
Gross unit profit is a per-order contribution margin: what one order contributes after the variable costs of selling it, before you account for acquisition. This is the same logic as contribution margin, applied to a single customer's first order.
Step 3: Subtract customer acquisition cost (CAC)
Now bring in what it cost to win the customer. Take total acquisition spend for the period and divide by new customers.
CAC = acquisition spend / new customers
Subtract CAC from gross unit profit and you have your unit contribution margin: the profit or loss on a customer's first order after paying to acquire them.
Unit contribution margin = gross unit profit - CAC
This is where it gets interesting. The result can be positive, break even, or negative, and a negative number is not the end of the story.
Step 4: Check CAC payback against LTV
If the first order does not cover CAC, the question becomes how long it takes repeat purchases to pay it back. That is where Lifetime Value (LTV) comes in.
Each repeat order from the same customer adds gross profit without adding new CAC, so cumulative contribution climbs over time. The point at which cumulative contribution crosses zero is your CAC payback period. A widely cited health benchmark is an LTV:CAC ratio of roughly 3:1, but the more practical operating rule below is the payback window itself.
A Worked Example: April 2026 New-Customer Cohort
Numbers make this concrete. Assume these figures for new customers acquired in April 2026.
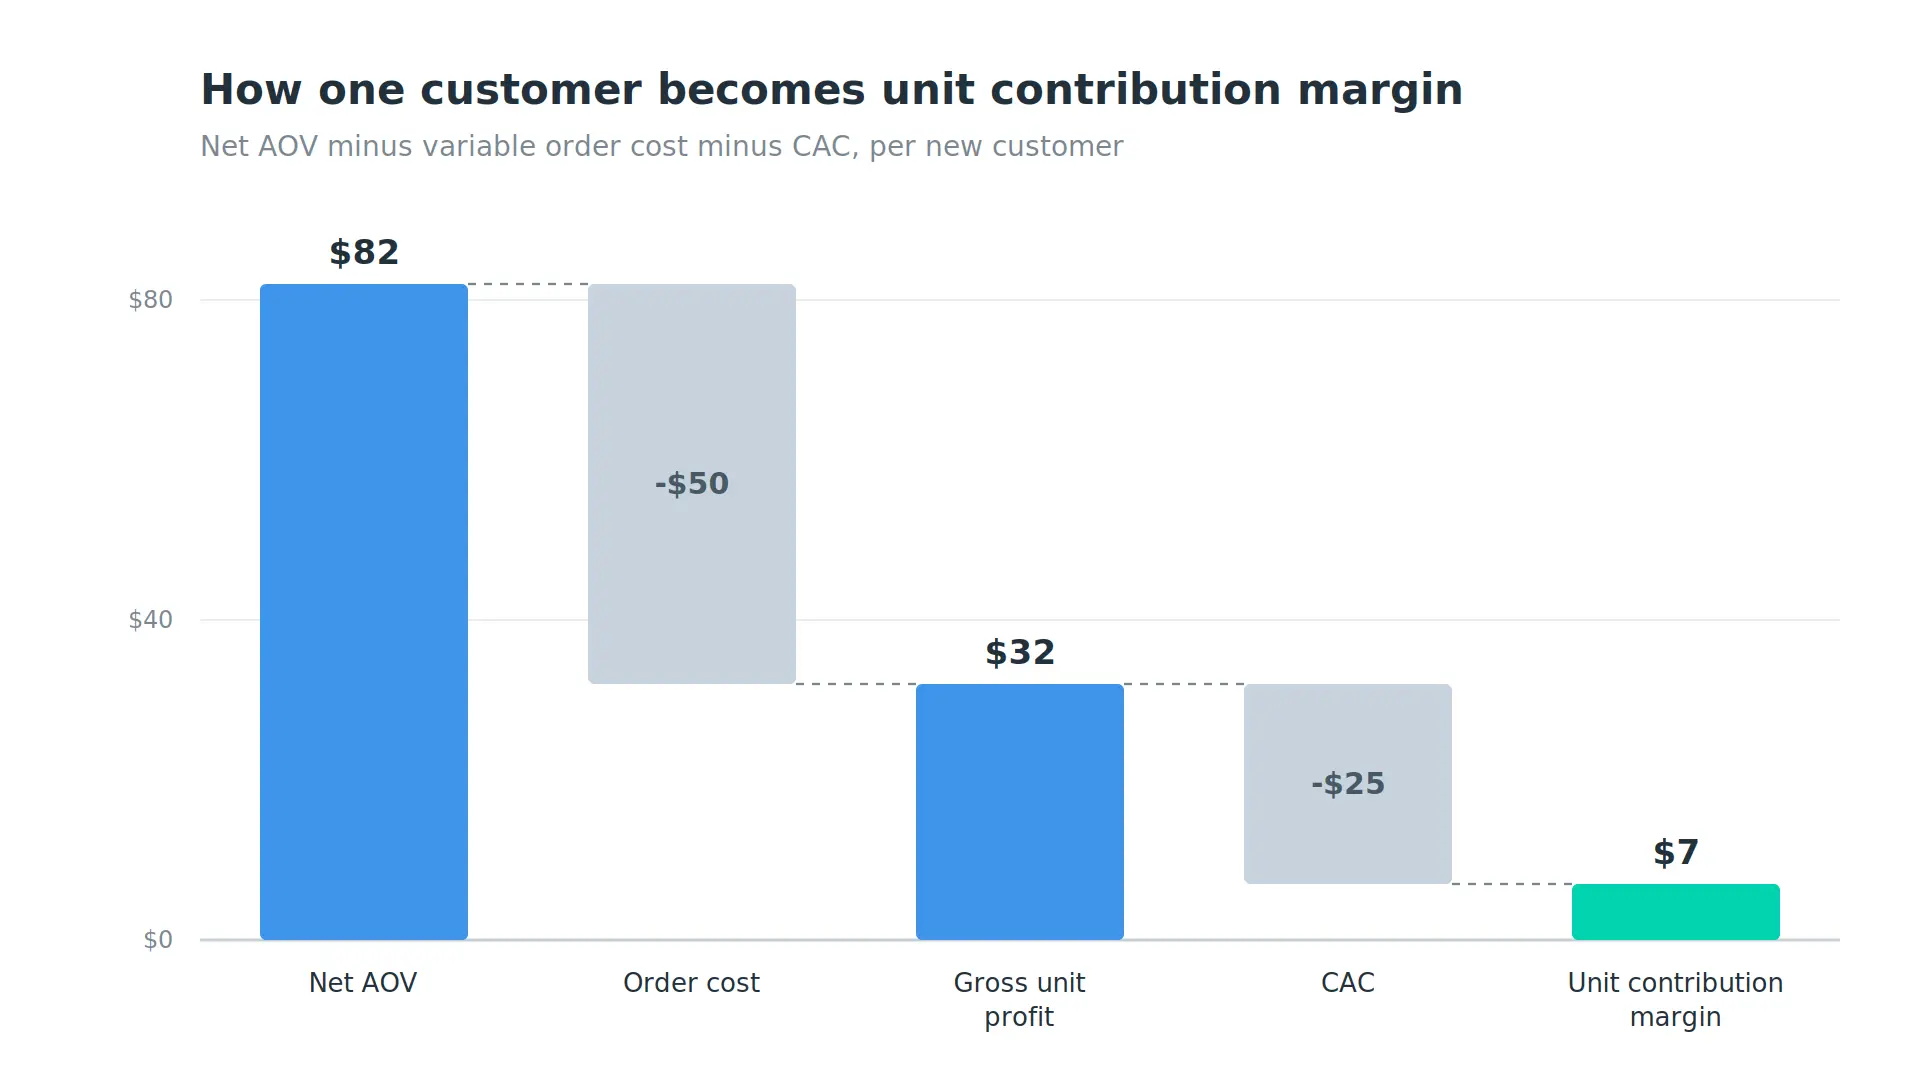
Scenario 1: Profitable on the first order
Line | Value |
Net new-customer AOV | $82 |
Variable order cost | $50 |
Gross unit profit | $32 |
CAC | $25 |
Unit contribution margin | $7 |
Here the first order already covers acquisition and leaves $7 of contribution toward overhead. Every new customer adds margin from day one. This is the position that lets you scale spend with confidence.
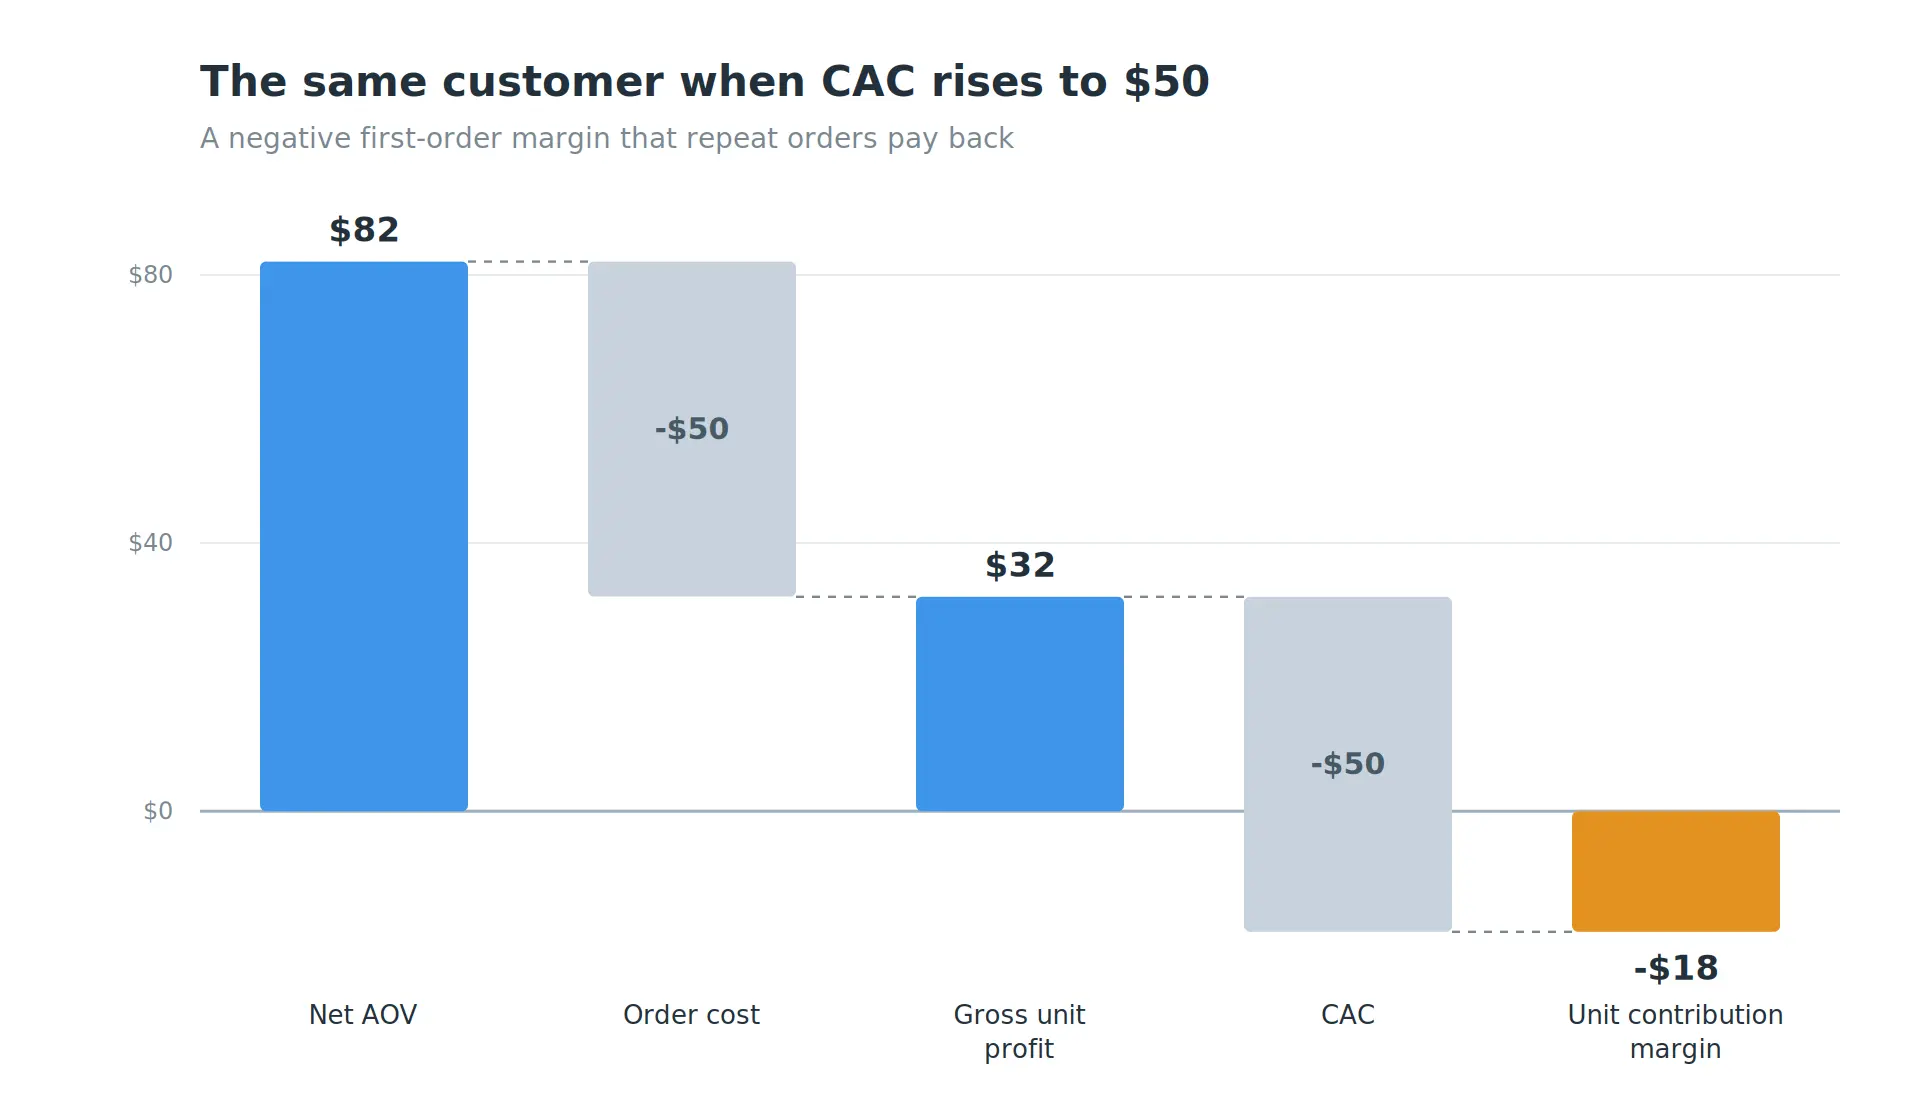
Scenario 2: Underwater on the first order, paid back by repeats
Line | Value |
Net new-customer AOV | $82 |
Variable order cost | $50 |
Gross unit profit | $32 |
CAC | $50 |
Unit contribution margin | -$18 |
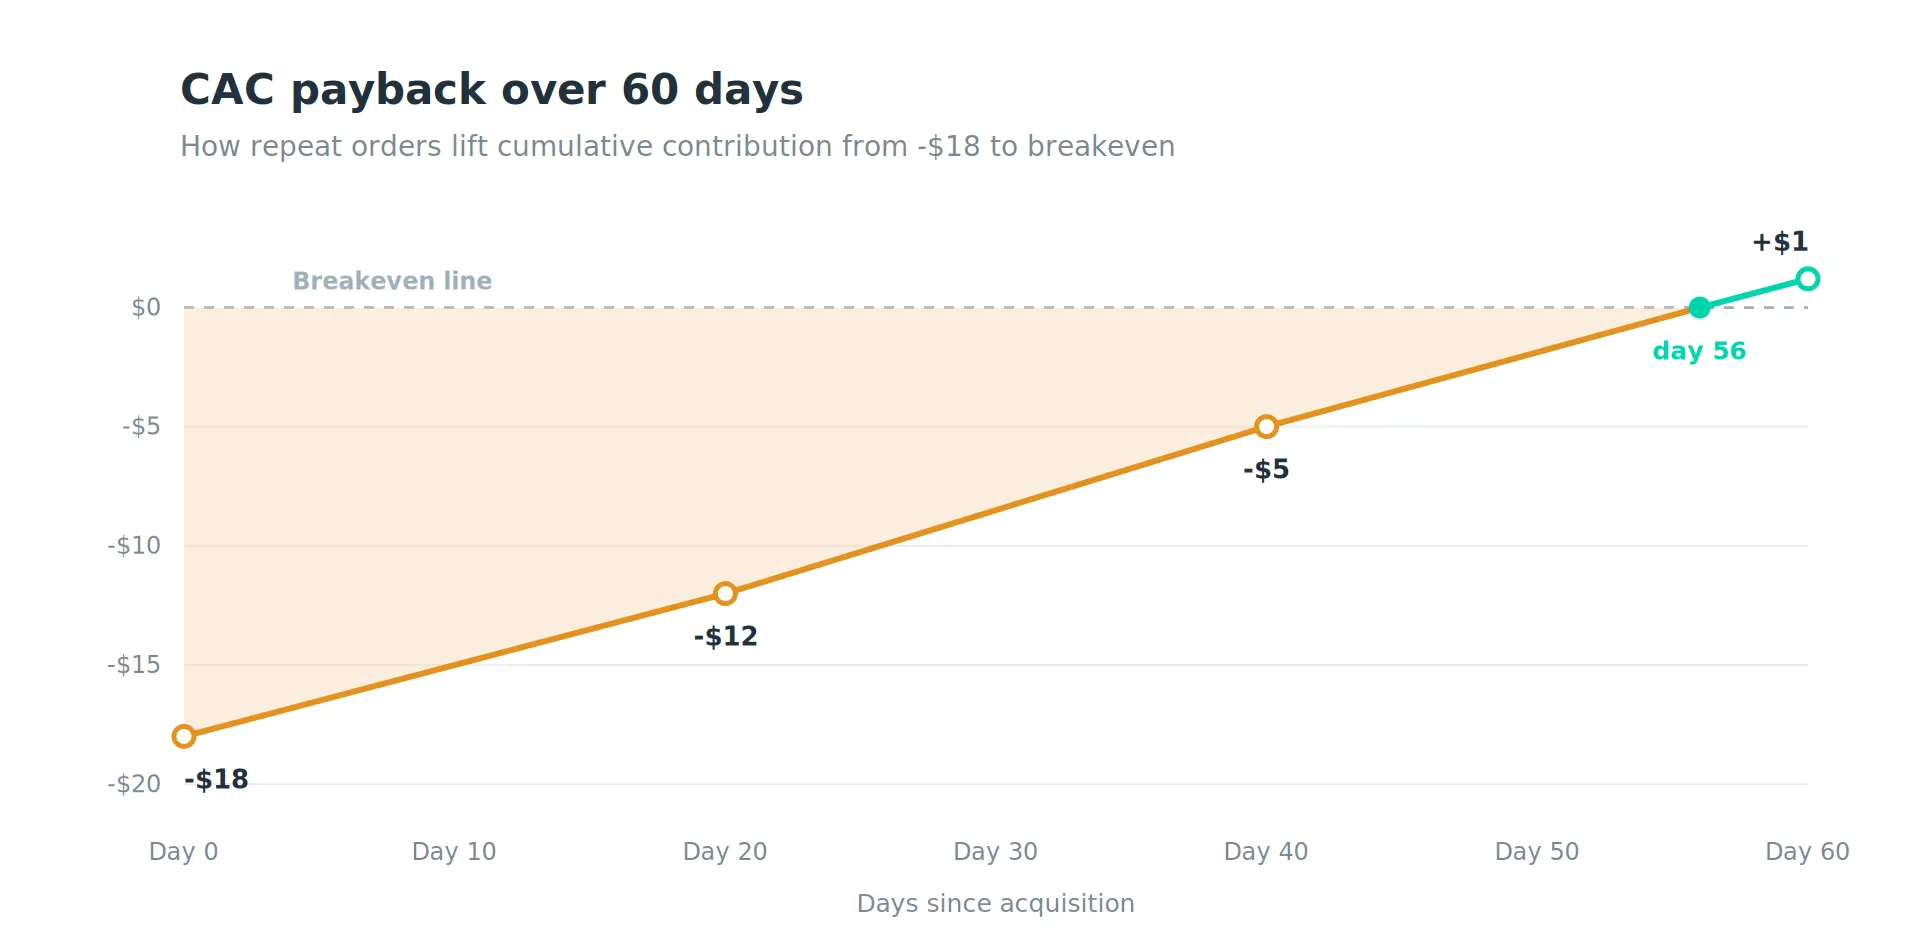
The first order loses $18 after acquisition. On its own that looks like a losing channel. But acquisition is a one-time cost, and repeat orders keep adding $32 of gross profit each. Tracking cumulative contribution for this cohort over 60 days looks like this:
Day | Cumulative contribution per customer |
Day 0 | -$18 |
Day 20 | -$12 |
Day 40 | -$5 |
Day 56 | $0 |
Day 60 | +$1 |
The cohort recovers its CAC around day 56 and clears the 60-day window by a hair. Because that payback lands inside 60 days, this acquisition is healthy even though the first order was negative, but it is close to the line. Run the same trend for every cohort, since payback speed shifts with product, price point, and repeat rate.
What the Numbers Tell You
One cohort teaches mechanics. The decisions show up when you run the same calculation month over month. Here are five new-customer cohorts from January to May 2026, each with the same waterfall applied and payback measured against a 60-day window.
Cohort | Net AOV | Order cost | CAC | Repeat orders (60d) | Gross unit profit | Unit contribution margin | CAC payback | 60-day contribution |
Jan | $82 | $50 | $28 | 0.5 | $32 | +$4 | Day 0 (profitable) | $20 |
Feb | $80 | $50 | $34 | 0.5 | $30 | -$4 | ~16 days | $11 |
Mar | $84 | $51 | $40 | 0.55 | $33 | -$7 | ~23 days | $11 |
Apr | $82 | $50 | $50 | 0.6 | $32 | -$18 | ~56 days | $1 |
May | $83 | $50 | $58 | 0.6 | $33 | -$25 | Over 60 days | -$5 |
The pattern is the point. CAC climbs from $28 to $58 across the five months while gross unit profit stays flat near $32, so payback stretches until it breaks. Jan is profitable on the first order. Feb and Mar recover fast. Apr just clears the window. May never pays back inside 60 days. Read against the three questions, each row is a decision.
Customer value: are my customers profitable? The unit contribution margin, read alongside payback, tells you. Jan is profitable from day one. Feb through Apr are negative on the first order but pay back inside the window, so they are still profitable customers, just on a delay. May is the one to worry about.
Ad profitability: are my ads paying for themselves? CAC sits at the center of the calculation, so unit economics is a direct read on ad efficiency at the customer level. By May, CAC has swallowed gross unit profit and payback runs past the window, which means the ads driving that cohort are not carrying their weight. This is the per-customer companion to a blended view like Marketing Efficiency Ratio (MER).
Scale decision: should I spend more or less? Payback speed is the signal. Jan and the fast-recovering cohorts can take more budget. May should be held or trimmed until the economics tighten, and Apr is close enough to the line to watch. The rule of thumb we operate on: a new-customer cohort should pay back its CAC within 60 days of acquisition. For an April cohort, that means recovering acquisition cost before the end of June.
How to Track Unit Economics without a Spreadsheet Mess
The math is simple. Getting clean inputs every month is not. Real unit economics needs new-customer revenue separated from repeat revenue, returns netted out, every variable cost captured, ad spend attributed to the right cohort, and repeat purchases tracked over a 60-day window. Doing that by hand across cohorts is where most stores give up.
A Shopify profit-analytics tool that separates new and returning customers, pulls variable costs and ad spend automatically, and tracks contribution margin over time turns unit economics from a quarterly spreadsheet project into a number you can check any day. That is the layer Bloom Analytics is built for.
Frequently Asked Questions
What is ecommerce unit economics?
Ecommerce unit economics is the profit and cost of your business measured per customer. You start with one new customer's net revenue, subtract variable order costs and acquisition cost, and see whether that customer is profitable and how long it takes to pay back what you spent to acquire them.
How do you calculate unit economics for an ecommerce store?
Take net new-customer AOV, subtract variable order costs to get gross unit profit, then subtract CAC to get unit contribution margin. If the first order does not cover CAC, track cumulative contribution from repeat orders until it crosses zero, which is your payback period.
Why should you use only new-customer revenue?
Acquisition spend applies to customers you won this period, so mixing in repeat-customer revenue makes acquisition look more profitable than it is. Isolating new customers is what makes unit economics a true test of whether your acquisition is working.
What is a good CAC payback period for ecommerce?
A common operating target is recovering CAC within 60 days of acquisition, and a healthy LTV:CAC ratio is often cited around 3:1. The right number depends on your margins and cash position, but faster payback always means more room to scale.
Is unit economics the same as contribution margin?
They are related. Gross unit profit is a per-order contribution margin: revenue minus variable costs. Unit economics extends it by also subtracting customer acquisition cost and looking across the customer's lifetime, not just a single order.
Know Your Real Profit And
The Ads That Actually Sell.
No need to spend. Just try it on your store.